From Innovation to Scale
A global analysis of green technology leadership and market value pools.
The green-technology market has moved beyond a single transition narrative. It now operates as a portfolio of scaled hardware, enabling systems, project-engineered decarbonization and locally specific resilience solutions – each with different country leaders, margin structures and commercialization risks.
Market at a glance
The market has crossed USD 1tn, but policy direction still creates an approximately USD 1tn spread in the 2035 outcome.
China controls the scale layer: around 85% of solar and 80% of lithium-ion battery supply-chain capacity.
Leadership is technology-specific – not national in the abstract. Patent, deployment, manufacturing and resource leaders are different markets.
The moat is shifting toward grids, storage, charging, software, service, recycling and project integration as hardware commoditizes.
Hydrogen, CCUS and near-zero materials offer large option value, but weak offtake and low final-investment-decision rates keep them policy-sensitive.
A trillion-dollar market is becoming a portfolio of different economics
The combined market value of clean-energy technologies reached nearly USD 1.2tn in 2025 after growing about 20% annually over the preceding decade. By 2035, IEA scenarios place it near USD 2tn under current policies and almost USD 3tn under stated policies; electric cars account for roughly three-quarters of value in either case. The market is therefore large, but its growth, margin and risk profiles diverge sharply by layer.
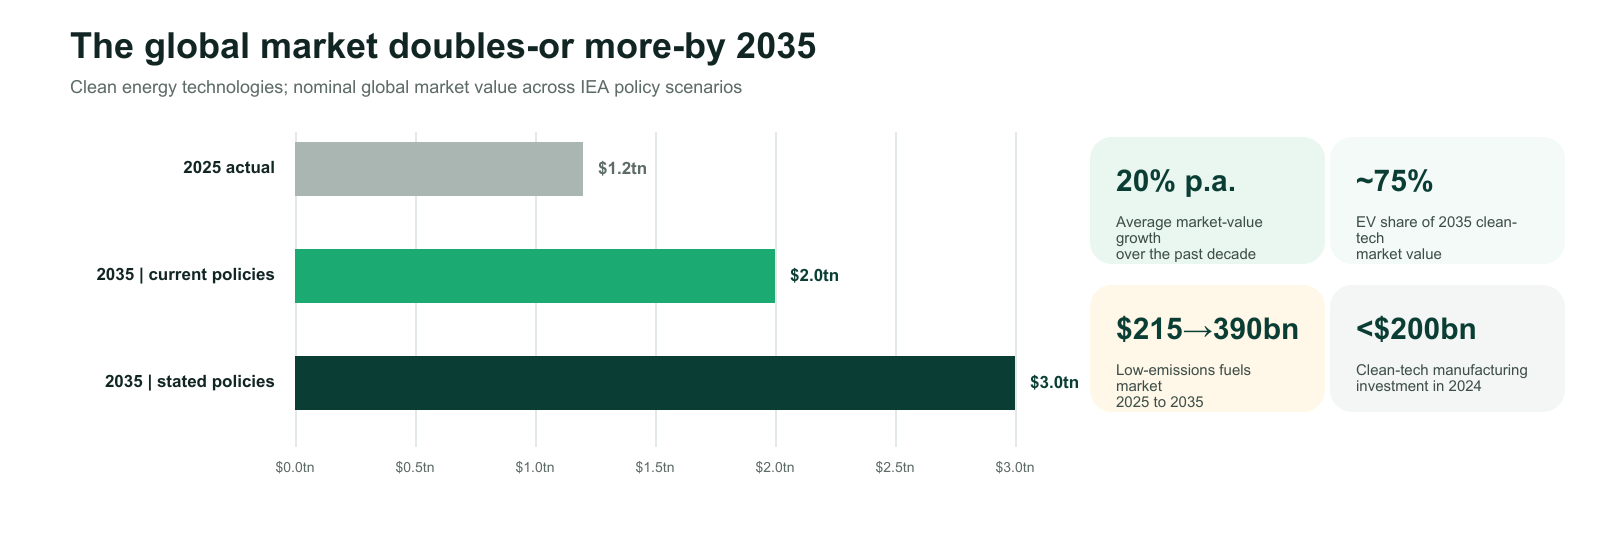
Exhibit 1. Global green-technology market scale. Clean energy technologies; nominal global market value across IEA policy scenarios.
Where defensible value pools are forming
Forecast the full system, not a product in isolation. Category models should connect equipment demand to grid access, utilization, input costs, financing, service revenue, policy durability, trade exposure and end-of-life economics.
Commercial maturity now matters more than the green label
The category is bifurcating. Modular technologies such as solar PV, batteries and EVs increasingly compete on manufacturing and distribution economics. Grid, charging and software markets monetize bottlenecks. Hydrogen, CCUS and near-zero materials remain project-engineered and policy-sensitive, while circularity and adaptation solutions require local payer and adoption models. A single top-down CAGR therefore obscures the commercial reality.
Four signals separating bankable from aspirational
Scaled hardware needs price, channel and competitor intelligence. Enabling systems need node-level infrastructure and regulatory analysis. Project-engineered segments need bankability, offtake and FID tracking. Adaptation and circularity need payer mapping, outcome evidence and primary research on local fit.
Six questions for category screening
No country leads the whole market – each controls a different layer
Leadership should be read across four dimensions: manufacturing scale, innovation intensity, deployment depth and resource or industrial advantage. WIPO's latest mapping illustrates the fragmentation: China dominates absolute green-patent volume, Denmark leads green-patent intensity, Sweden and Germany specialize in EV innovation, and Brazil and India stand out in biocontrol. Deployment and project evidence identify additional leaders that patent counts alone miss.
Table 1. Selected country-technology leadership poles.
Innovation is concentrating in systems – and in a few origins
Global green patent families nearly quadrupled between 2003 and 2023 to about 412,300, but concentration intensified. China accounted for 71.9% of 2023 families, while smart grids, batteries and air-pollution control represented 41.8% of the 2021–2023 technology portfolio. At the regional level, 20% of OECD regions produced 80% of green patents in 2021. Innovation scale, however, is only one input into commercial advantage.
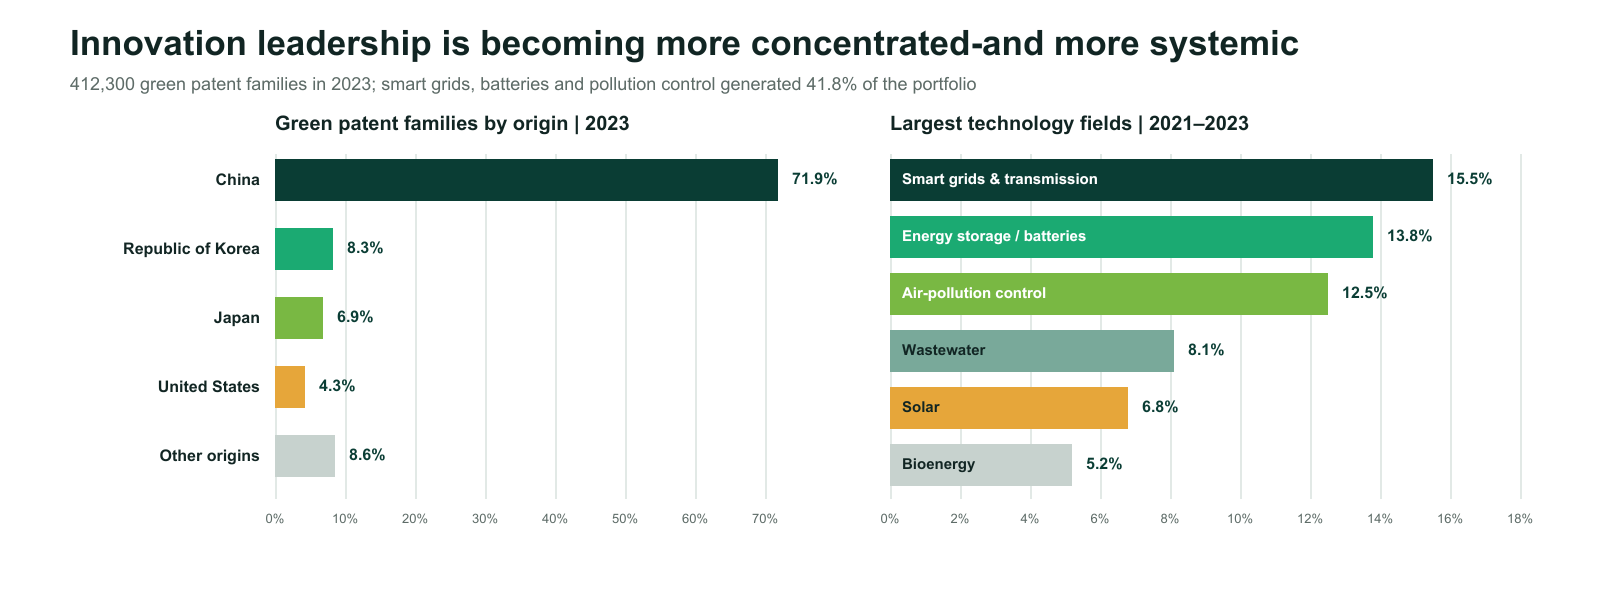
Exhibit 2. Green-innovation concentration. 412,300 green patent families in 2023; smart grids, batteries and pollution control generated 41.8% of the portfolio.
A five-filter market-entry lens
Latecomer advantage is selective. Strong entry routes typically combine one capability adjacency with a market-specific bottleneck rather than competing head-on in globally oversupplied modules. UNCTAD's evidence indicates that policy execution can compensate for weak initial conditions when technology choice matches local capabilities.
Four market-entry archetypes
The best sourcing market may not be the best launch market. Compare countries separately for supply economics, IP access, regulatory pull, customer readiness, infrastructure and the availability of local integration partners.
The next race is to solve scarcity, not just add capacity
The constraint set has shifted from technology availability to system execution. China holds around 85% of solar and 80% of lithium-ion battery supply-chain capacity, with even higher shares in PV wafers and anode materials. Across key energy minerals, the top three refining countries controlled 86% in 2024; the project pipeline still indicates a potential 30% copper shortfall by 2035.
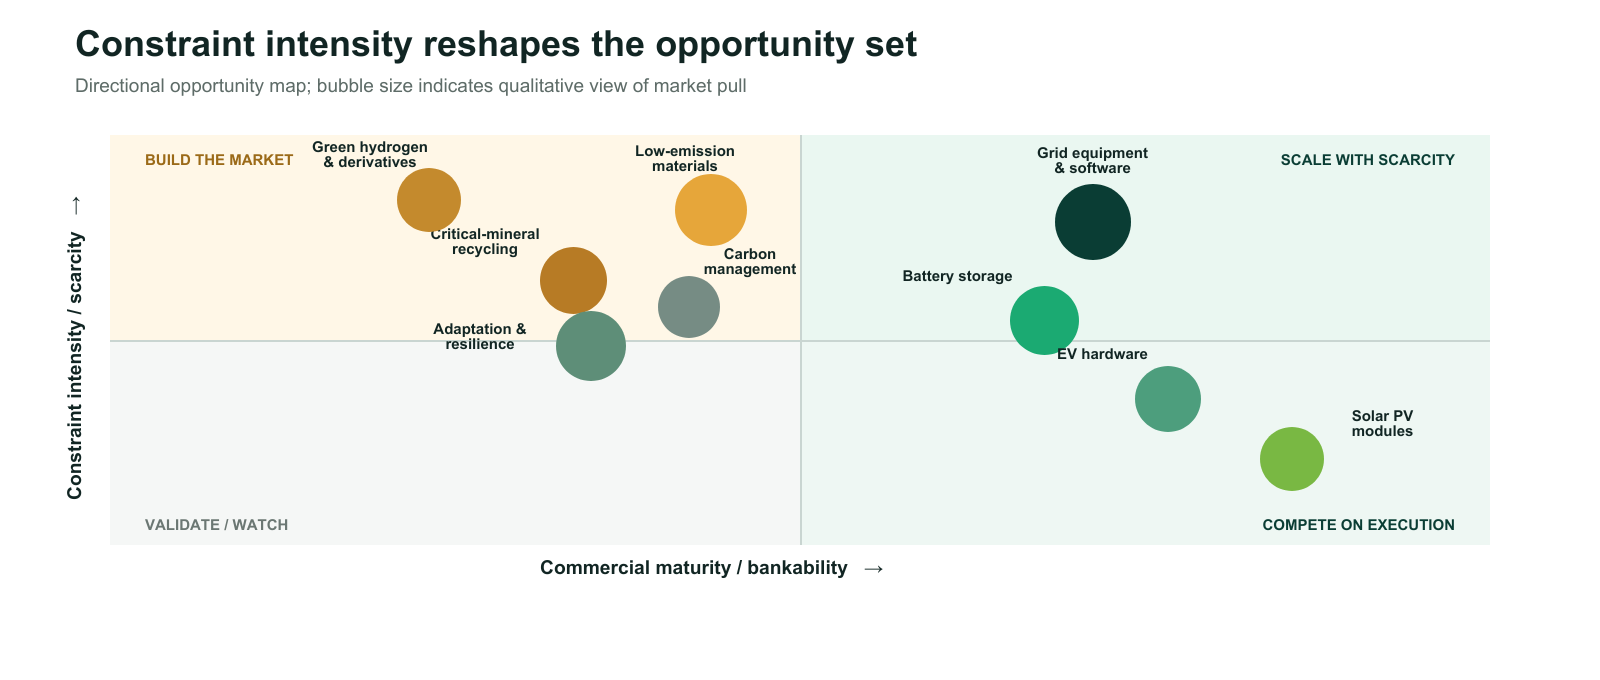
Exhibit 3. Green-technology opportunity matrix. Directional opportunity map; bubble size indicates a qualitative view of market pull.
Four white spaces with durable research demand
Separate volume growth from margin retention; map country-specific value-chain bottlenecks and trade exposure; test bankability and policy durability; and validate buyer pain, willingness to pay and adoption barriers through primary research. This is where category forecasts become decision intelligence.
Fajardy, M., Greenfield, C., & Koduah, J. T. (2025, April 30). CCUS projects around the world are reaching new milestones. International Energy Agency.
International Energy Agency. (2024a). Global hydrogen review 2024.
International Energy Agency. (2024b). Renewables 2024: Analysis and forecast to 2030.
International Energy Agency. (2025a). Brazil 2025: Energy policy review.
International Energy Agency. (2025b). Germany 2025: Energy policy review.
International Energy Agency. (2025c). Global critical minerals outlook 2025.
International Energy Agency. (2025d, June 24). Japan 7th Strategic Energy Plan.
International Energy Agency. (2026a). Energy technology perspectives 2026.
International Energy Agency. (2026b). Global EV outlook 2026.
International Renewable Energy Agency. (2026). Renewable capacity statistics 2026.
Peñalosa, P., & Kleine-Rueschkamp, L. (2024). The geography of green innovation hubs in OECD regions (OECD Local Economic and Employment Development Papers No. 2024/09). OECD Publishing.
Suh, S., Bergesen, J. D., Gibon, T. J., Hertwich, E. G., & Taptich, M. (2017). Green technology choices: The environmental and resource implications of low-carbon technologies. International Resource Panel, United Nations Environment Programme.
United Nations Conference on Trade and Development. (2023). Technology and innovation report 2023: Opening green windows – Technological opportunities for a low-carbon world. United Nations.
United Nations Environment Programme. (2024). Global resources outlook 2024: Bend the trend – Pathways to a liveable planet as resource use spikes. International Resource Panel.
United Nations Environment Programme. (2025). Adaptation gap report 2025: Running on empty.
World Intellectual Property Organization. (2022). Green technology book: Solutions for climate change adaptation.
World Intellectual Property Organization. (2026). Mapping green innovation: An overview of the new WIPO IPC–green technology concordance.
Research built for green-technology decisions
ESIQ provides bespoke intelligence, market mapping, and voice-of-customer research for organisations navigating the green-technology landscape - whether as manufacturers, investors, project developers or policymakers.
Market Sizing & Value-Pool Analysis
Segment-level market models connecting equipment demand to grid access, utilization, financing and service revenue.
Technology & Bankability Screening
FID tracking, offtake mapping and commercial-maturity assessment across hydrogen, CCUS and near-zero materials.
Country & Competitive Landscape
Leadership mapping across manufacturing scale, innovation intensity, deployment depth and resource advantage.
Supply-Chain & Scarcity Intelligence
Critical-mineral concentration, refining exposure, recycling economics and trade-policy risk assessment.
Market-Entry Strategy
Five-filter country screening across demand certainty, capability adjacency, infrastructure, capital access and adoption capacity.
Voice of Customer Research
Primary research on buyer pain, willingness to pay, payer models and adoption barriers across green-technology categories.
Scaling a green technology strategy?
ESIQ partners with investors, corporates and policymakers to turn green technology ambition into investable, decision-grade strategy.