
From Ambition to Market Reality: Where Could India’s Green Hydrogen Opportunity Emerge?
A scenario-based view of demand, supply, sector adoption and the emerging market gap.
Authored by Parvez Momin
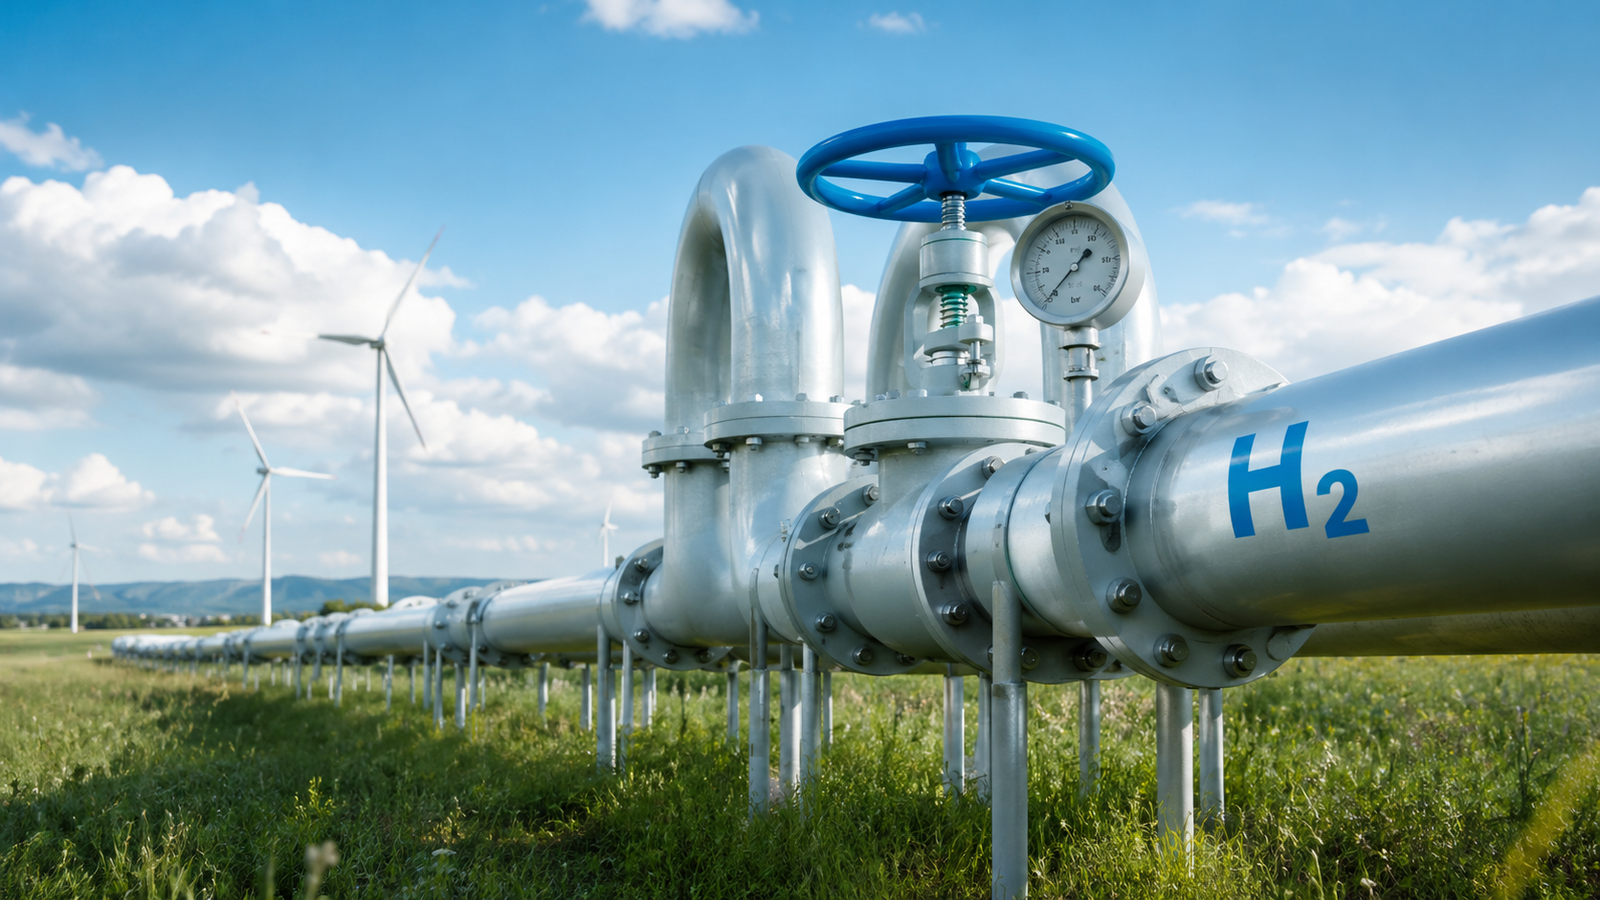
India’s green hydrogen opportunity is moving into a more demanding phase. The National Green Hydrogen Mission targets at least 5 million tonnes per annum (MMTpa) of green hydrogen production by 2030 and positions India as a hub for production, use and exports. Yet the key market question is no longer simply how much capacity has been announced. It is whether projects will reach operation, whether industrial consumers will adopt green hydrogen at scale, and whether production economics and infrastructure can support bankable demand.
The latest ESIQ India Green Hydrogen Market Model takes a bottom-up approach to this question. It maps demand across ammonia, refining, steel, methanol, mobility, shipping and other/export applications, while separately tracking production projects, contracted offtake, infrastructure and export pipelines. The model uses Low, Base and High scenarios and keeps demand, nameplate capacity, probability-adjusted capacity and expected production as distinct concepts. This is important in a market where announced capacity can materially exceed projects that are ready to produce.
Market at a glance
Five takeaways for market participants
Base-case 2030 domestic demand is about 3.47 MMT, against 1.90 MMT in the Low case and 5.16 MMT in the High case — scenario range matters more than a single-point forecast.
Supply is the binding constraint: gross nameplate capacity reaches 0.81 MMT by 2030, but probability-adjusted capacity is 0.48 MMT and expected production only 0.31 MMT.
Demand is concentrated in ammonia (~1.81 MMT) and refining (~1.47 MMT); steel, methanol, shipping and mobility remain small and lower-confidence.
Policy is already converting into procurement: 862,000 tpa of capacity awarded and green-ammonia price discovery completed for 724,000 tpa to 13 fertiliser units.
Project databases must separate commissioned, under-construction, awarded and announced capacity — treating all announcements as equally probable overstates supply.
In the current working model, the Base case places India’s domestic green hydrogen demand at about 3.47 MMT in 2030, compared with 1.90 MMT in the Low case and 5.16 MMT in the High case. The model is deliberately more conservative on supply: gross nameplate production capacity reaches about 0.81 MMT H₂-equivalent by 2030, while probability-adjusted capacity is about 0.48 MMT and expected actual production about 0.31 MMT.
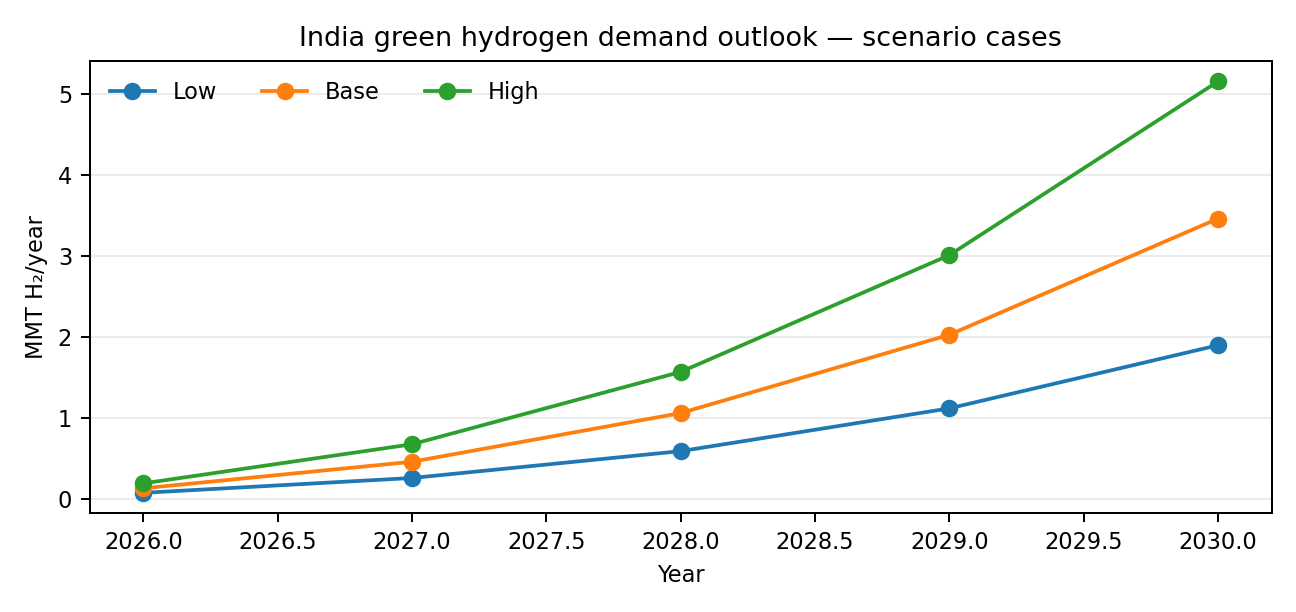
Figure 1. India green hydrogen demand outlook under Low, Base and High cases. Source: ESIQ Green Hydrogen Market Model v4.1.
Note: Model outputs are working estimates and are subject to iteration as project, demand and policy evidence improves. The 2021–2025 historical demand series is not treated as a comparable commercial market series because official green-hydrogen consumption data is limited.
The demand opportunity is concentrated in a few industrial sectors
The model’s 2030 Base case is dominated by established industrial hydrogen applications rather than mobility or other early-stage uses. Ammonia and refining together account for the overwhelming majority of modelled demand. This reflects the fact that these sectors already consume hydrogen and have clearer substitution pathways, whereas steel, methanol, shipping and mobility require new infrastructure, technology deployment or stronger economics before they can become large-scale demand centres.
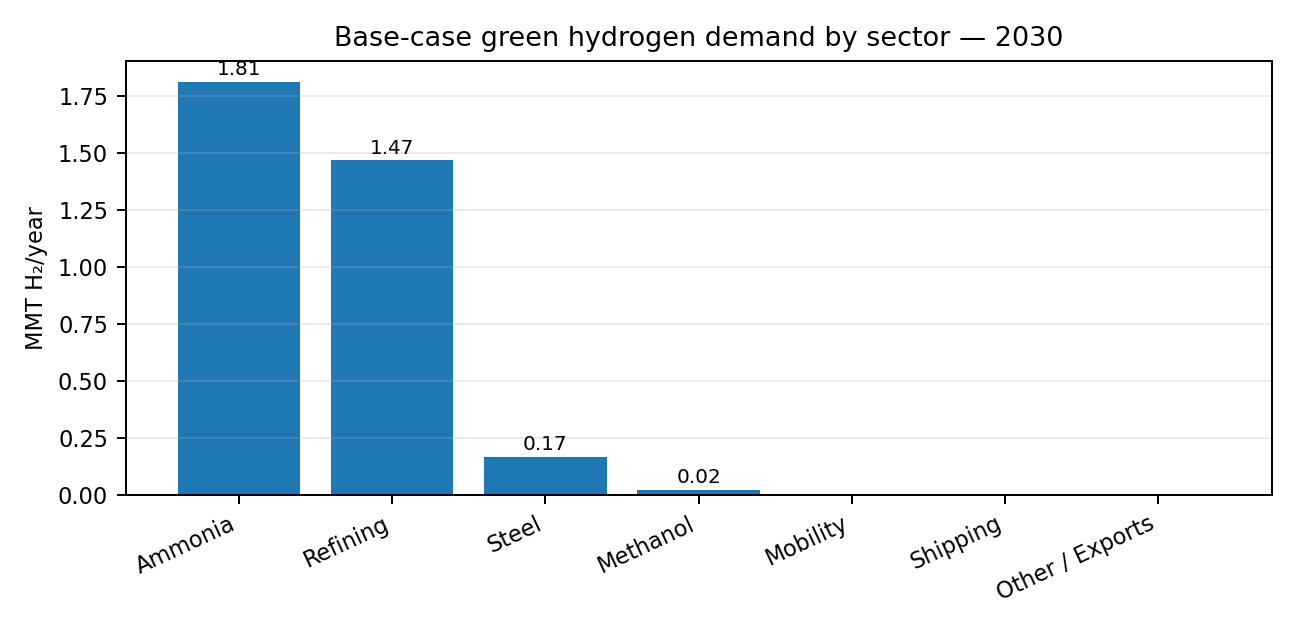
Figure 2. Base-case sector composition of domestic green hydrogen demand in 2030. Source: ESIQ Green Hydrogen Market Model v4.1.
Within the model, ammonia contributes about 1.81 MMT and refining about 1.47 MMT of 2030 Base-case demand. Steel contributes approximately 0.17 MMT, while methanol is about 0.02 MMT. Mobility and shipping remain comparatively small in the current model and are treated as lower-confidence, lighter-touch demand estimates. This hierarchy is useful because it separates commercially anchored demand from applications where adoption is still developing.
The central question is execution, not announcements
The model highlights a potential supply-demand mismatch. In the Base case, total production requirement — including the identified contracted export volume — reaches roughly 3.54 MMT in 2030, versus probability-adjusted capacity of only 0.48 MMT and expected production of about 0.31 MMT. This produces a modelled 2030 capacity gap of approximately 3.06 MMT and a production gap of approximately 3.23 MMT.
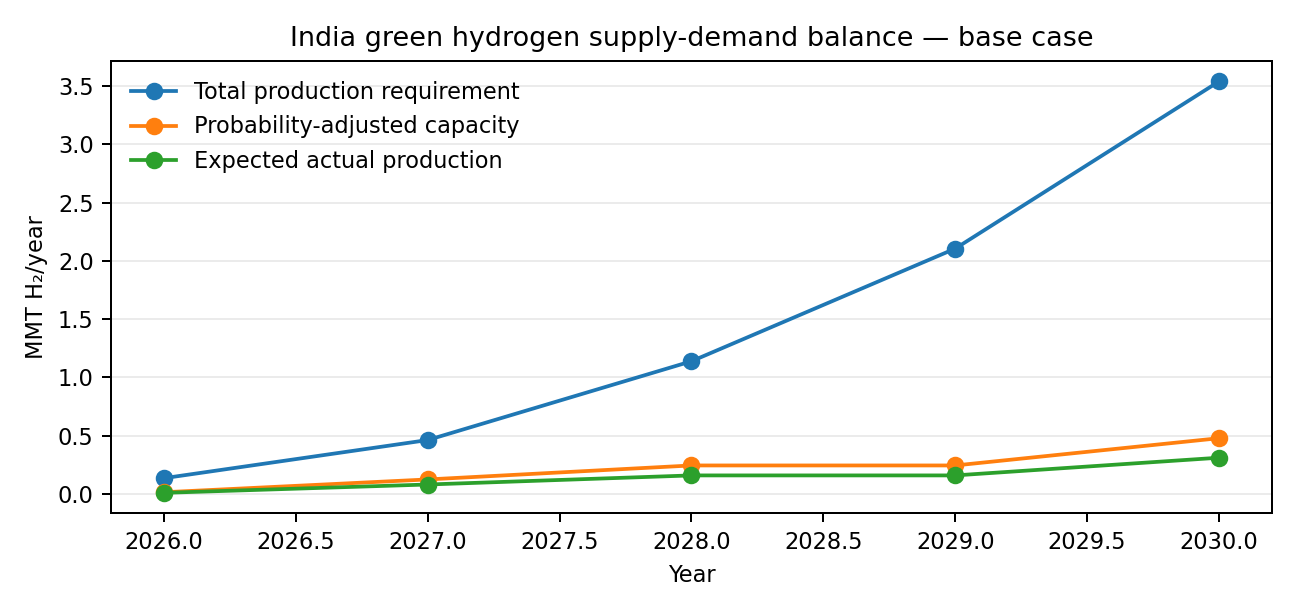
Figure 3. Base-case production requirement versus probability-adjusted capacity and expected production. Source: ESIQ Green Hydrogen Market Model v4.1.
The implication is not that India will necessarily experience a physical hydrogen shortage. Rather, the model identifies the amount of additional capacity and project execution that would be required if the forecast demand materialises. It also shows why project databases need to distinguish commissioned projects, projects under construction, awarded projects and announced projects, instead of treating all announced capacity as equally probable.
The next phase of market development
Economics will remain decisive. The National Green Hydrogen Mission itself identifies electrolyser and renewable-energy costs as major components of green hydrogen production economics, alongside financing, water, storage, distribution, conversion to derivatives and enabling infrastructure. Lower-cost renewable electricity, improving electrolyser performance and scale, better financing structures and aggregation of demand can therefore materially change the adoption curve.
Policy support is already translating into procurement and production mechanisms. Government data published in March 2026 reported 862,000 tonnes per annum of green hydrogen production capacity awarded under the Mission’s incentive scheme, while green-ammonia price discovery had been completed for 724,000 tonnes per annum of supply to 13 fertiliser units. These developments strengthen the case for ammonia as an early anchor market, while refinery procurement, steel pilots, shipping hubs and export projects could broaden the demand base over time.
Three questions will determine the trajectory
Can announced and awarded projects convert into operating capacity fast enough to close the emerging supply gap?
Can green hydrogen and its derivatives reach sufficient cost competitiveness to move beyond policy-supported offtake into broader commercial adoption?
Can India build the storage, transport, port, certification and export infrastructure needed to connect production with domestic and international buyers?
The outlook is therefore likely to be uneven rather than linear. Ammonia and refinery applications could provide the first substantial demand base, while steel, methanol, shipping, mobility and export markets may scale at different speeds depending on economics, technology readiness and policy support. Scenario analysis is consequently more useful than a single-point forecast.
The size of the opportunity should not be confused with the volume of capacity already capable of serving it.
Answering the market questions behind the numbers
ESIQ’s Green Hydrogen & Derivatives Analytics / Outlook service is designed to answer the market questions behind the numbers: How large could the market become? Which sectors will drive demand? Which projects are likely to add supply? Will the market face a capacity surplus or deficit? What are the key cost and price drivers? How much conventional hydrogen could green hydrogen substitute? And where could investment opportunities emerge?
The service brings together historical and forecast capacity mapping, bottom-up sector demand modelling, Low/Base/High scenarios, project and production databases, contracted-offtake and export pipeline tracking, demand and policy drivers, restraints, cost and price analysis, sensitivity analysis and demand–supply gap assessment. The platform is also being enhanced with Levelized Cost of Hydrogen (LCOH) analysis, enabling a deeper connection between project economics, hydrogen costs and market adoption.
Most importantly, the methodology is designed to triangulate the market rather than rely on a single headline estimate. Independent top-down cross-checks, bottom-up sector modelling and external benchmarks are compared, while evidence quality and project execution probability are explicitly considered.
India’s green hydrogen opportunity is substantial, but the size of the opportunity should not be confused with the volume of capacity already capable of serving it. The next phase will be defined by the conversion of announcements into projects, projects into production, and production into competitive industrial demand. That makes transparent market sizing, project intelligence, scenario analysis and production economics increasingly important for developers, investors, technology providers, industrial buyers and policymakers.
To explore ESIQ’s India Green Hydrogen & Derivatives Analytics / Outlook service, start a conversation with our research team.
ESIQ. (2026). India Green Hydrogen Market Model v4.1 (working model; August 2026). ESIQ Research.
Ministry of New and Renewable Energy. (2023). National Green Hydrogen Mission. Government of India.
Ministry of New and Renewable Energy. (2026). Hydrogen overview. Government of India.
Press Information Bureau. (2026, February). Press release on National Green Hydrogen Mission progress. Government of India.
Press Information Bureau. (2026, March). Green hydrogen production capacity awarded and green-ammonia price discovery. Government of India.
Methodology note: all model-derived figures in this article are indicative outputs from the working model and may change as the underlying project and demand evidence is updated. The article does not present proprietary market data. Sources accessed August 2026.
Research built for green-hydrogen decisions
ESIQ provides bespoke intelligence, market mapping, project tracking and voice-of-customer research for organisations navigating India’s green hydrogen landscape — whether as developers, investors, technology providers, industrial buyers or policymakers.
Bottom-Up Market Sizing
Sector-summed demand modelling across ammonia, refining, steel, methanol, mobility, shipping and exports under Low/Base/High scenarios.
Project & Production Databases
Capacity mapping that separates commissioned, under-construction, awarded and announced projects, with execution probability applied.
Demand–Supply Gap Assessment
Capacity and production gap quantification, including contracted offtake and identified export pipelines.
Cost & LCOH Analysis
Levelized Cost of Hydrogen modelling connecting electrolyser and renewable-power economics to market adoption.
Policy & Incentive Tracking
Mission incentive awards, price-discovery outcomes, procurement mechanisms and their effect on bankable demand.
Voice of Customer Research
Primary research on industrial buyer adoption barriers, willingness to pay and substitution economics across sectors.
Sizing India’s green hydrogen market?
ESIQ partners with developers, investors, technology providers, industrial buyers and policymakers to turn project pipelines into bankable market intelligence.
Continue the research
Cement Decarbonisation & Green Cement Solutions
The levers, technologies and economics reshaping one of the world's hardest-to-abate industrial sectors — and the commercial case for low-carbon construction.
Read More →
Biofuels & Sustainable Fuels
Enabling the transition to low-carbon mobility — the feedstocks, fuels, technologies, policy and economics decarbonising aviation, shipping and heavy transport.
Read More →
Marine Shipping Decarbonisation
Navigating the transition to low-carbon shipping — the regulations, fuels, infrastructure and freight economics reshaping global trade.
Read More →