
From Bunkering Cost to Carbon Cost
How Should Shipping Fuels Be Benchmarked in a Net-Zero World?

Marine fuel has long been benchmarked in US dollars per tonne. In 2026, with the EU ETS at full surrender and FuelEU Maritime in its second compliance year, that habit is becoming expensive. This article sets out a dimensionally consistent effective-cost framework, applies it to a defined Shanghai–Rotterdam container voyage under three scenarios, and separates the conclusions that are robust from those that depend on assumptions.
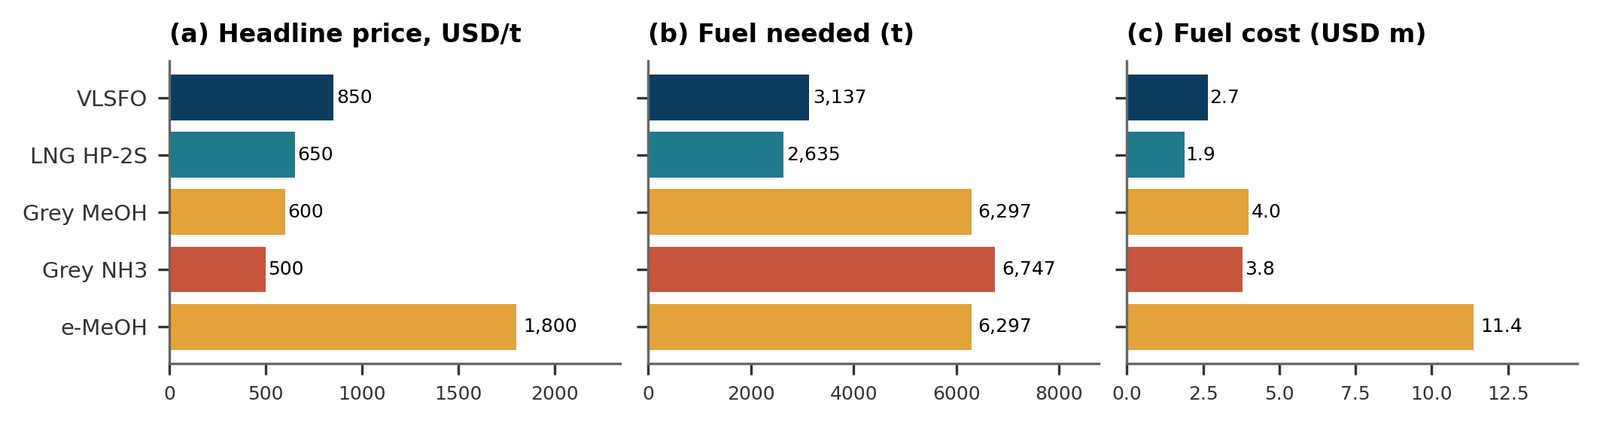
USD per tonne misleads: grey ammonia looks 40% cheaper than VLSFO per tonne, yet the voyage fuel bill is about 40% higher.
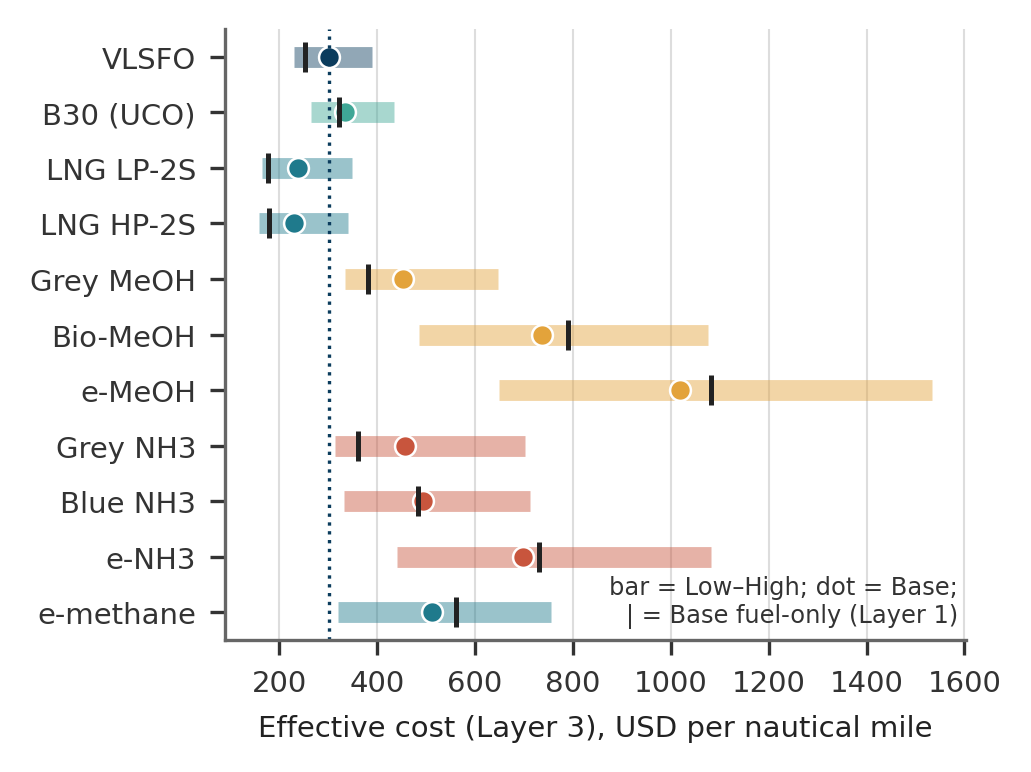
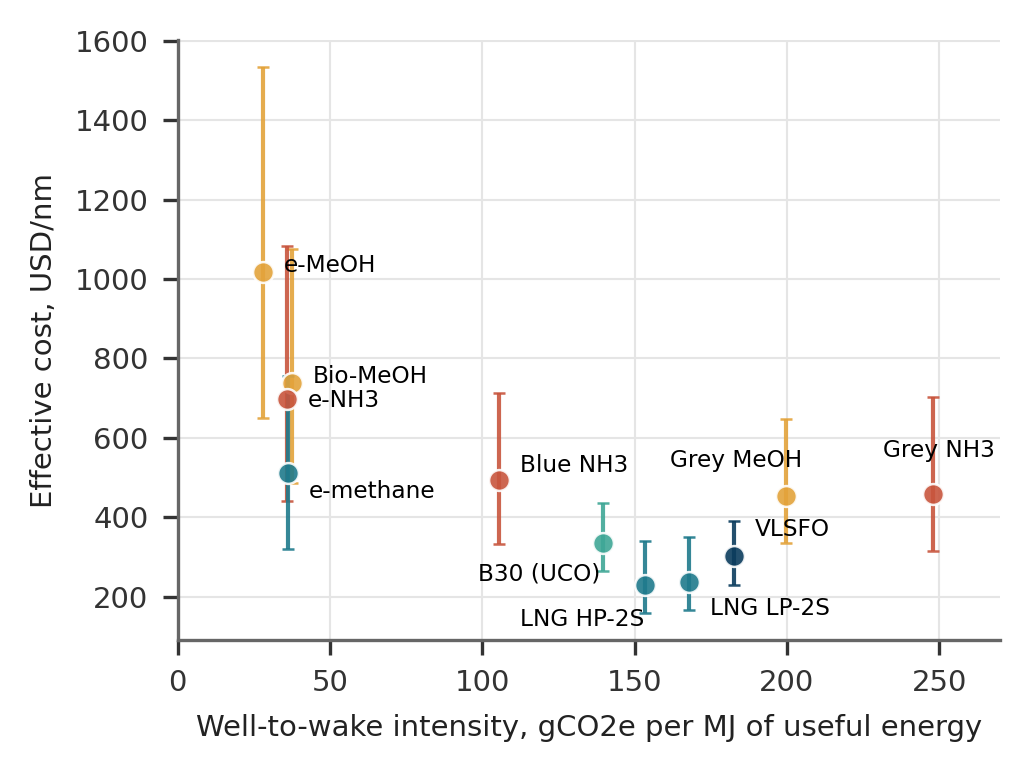
At 2026 prices, fossil LNG (USD 230–238/nm) and VLSFO (USD 301/nm) remain cheapest; every pathway below about 40 gCO₂e/MJ costs 1.4–3.9 times VLSFO.
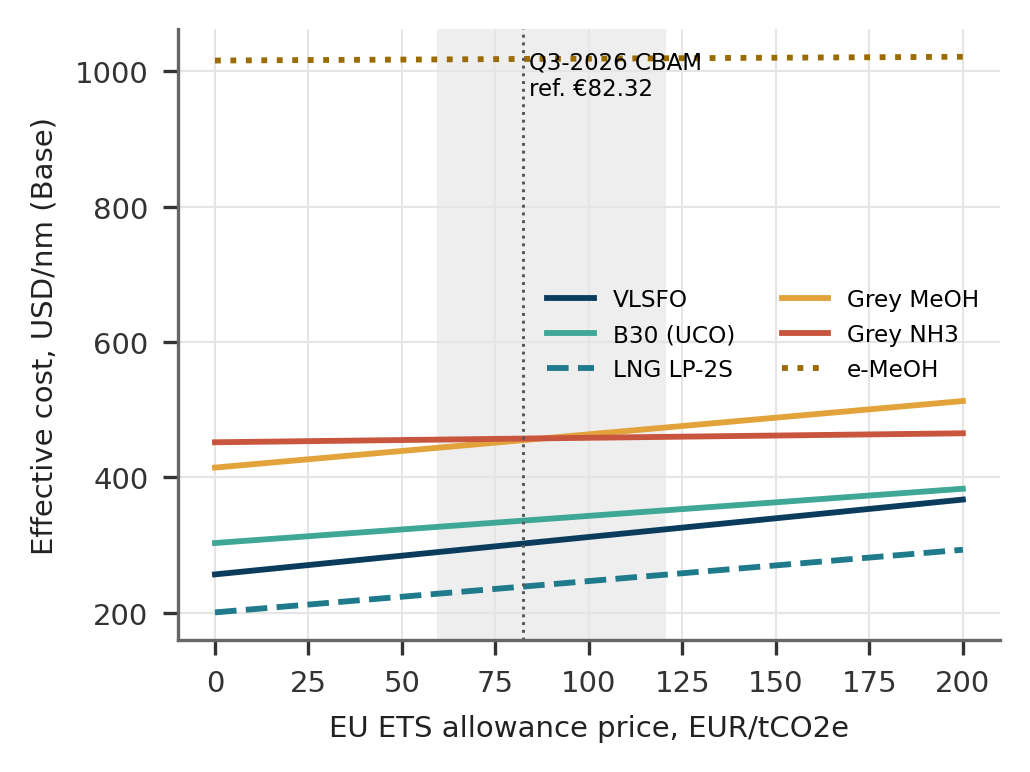
The EU ETS and FuelEU price emissions on different bases; for low-carbon fuels, FuelEU is the larger regulatory lever.
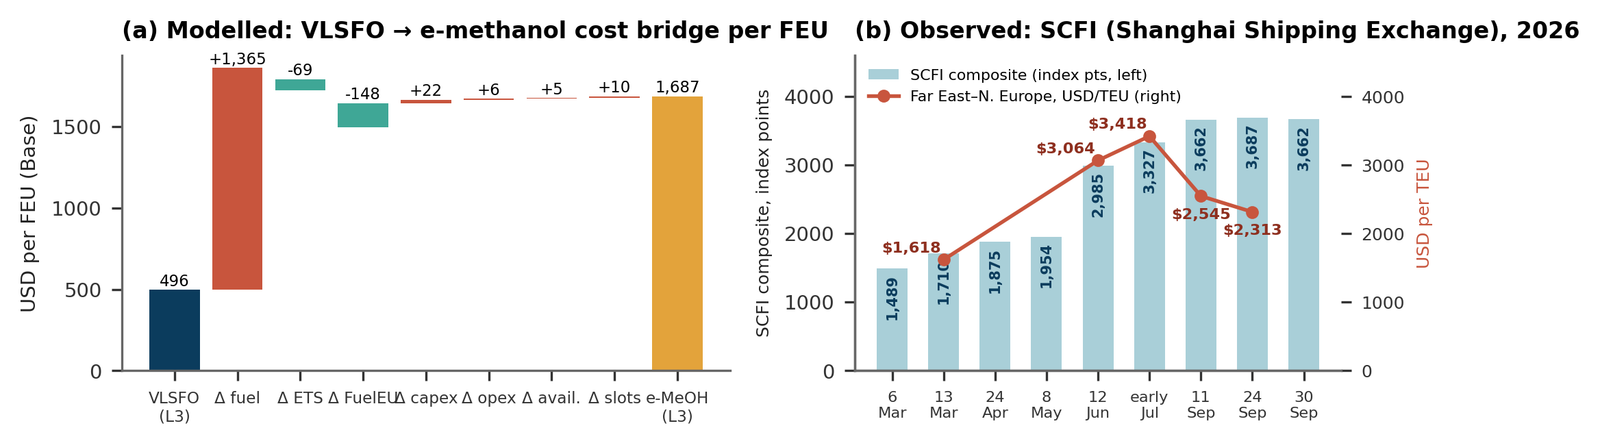
e-methanol adds about USD 595 per TEU on this voyage; a simple percentage method understates the increment about 2.5 times.
Fuel and carbon costs reach cargo through contracts and market balance – a fuel-price rise does not imply an equal freight-rate rise.
Why bunker price alone no longer tells the full story
Marine fuel has long been bought, budgeted and benchmarked in US dollars per tonne. In 2026 that habit is becoming expensive. Singapore VLSFO moved between roughly USD 793/t and USD 900/t in the first nine days of October [10][11], following a year in which the Hormuz disruption transmitted rapidly into bunker prices, insurance costs and freight [14]. At the same time, ships trading with Europe must now surrender EU allowances for 100% of in-scope 2026 emissions, with methane and nitrous oxide included for the first time [5], while FuelEU Maritime is in its second compliance year [7].
A per-tonne comparison misses three things that now drive the economics. First, fuels deliver very different amounts of energy per tonne: a tonne of methanol carries less than half the energy of a tonne of VLSFO. Second, regulation prices emissions on different bases (tank-to-wake tonnes under the EU ETS, well-to-wake intensity under FuelEU), so two fuels with similar prices can carry very different compliance bills. Third, alternative fuels need different engines, tanks, bunkering networks and safety systems. This article sets out a dimensionally consistent effective-cost framework, applies it to a defined voyage under three scenarios, and identifies which conclusions are robust and which depend on assumptions.
Three layers, one consistent unit
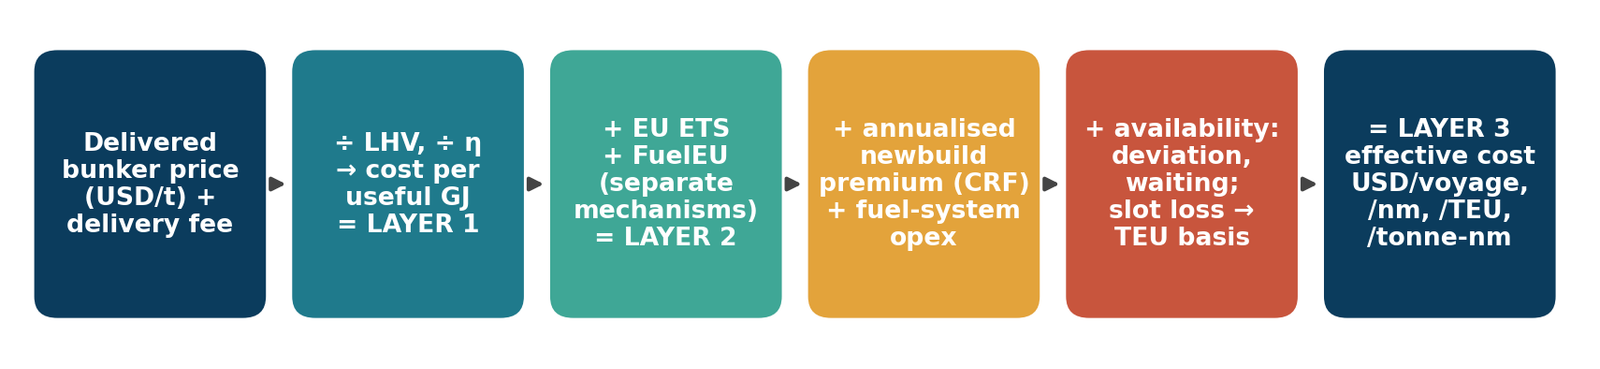
The intuitive expression ‘effective cost = bunker cost + energy requirement + carbon cost + infrastructure + availability premium’ adds quantities with different units. We restate it for a defined transport task with useful energy requirement Eu (GJ at engine output, identical for every fuel). For each fuel f with lower heating value LHVf, engine efficiency ηf and pilot-fuel energy share pf, the fuel energy input is Ef = Eu/ηf, the main-fuel mass is mf = Ef(1−pf)/LHVf and the pilot mass is mp = Ef·pf/LHVp. All terms are then in USD per voyage:
Here EETS is covered TtW CO₂e (fossil CO₂ plus CH₄ and N₂O) × geographic scope × surrender share; CFuelEU is the compliance balance (limit minus actual WtW intensity, times in-scope energy) priced at a pooling price or the penalty, negative when a surplus can be sold; K is the newbuild premium annualised by CRF = r/(1−(1+r)−n) over Nv voyages per year; Ofs is incremental fuel-system opex; Dav is deviation or waiting days at daily vessel cost cday. Results are normalised per nautical mile, per TEU (capacity × utilisation × (1 − tank-driven slot loss)) and per tonne-nm.
The delivered price already recovers producer cost, supplier terminal investment and margin, so supplier-side infrastructure is not added again; a delivery fee is added only where a quote is ex-terminal. No generic carbon charge is layered over the regulatory terms. ETS and FuelEU are both applied because they are distinct legal obligations on different metrics. Lost cargo slots change only the per-TEU denominator. Two views are reported: an operational view (Layer 2 + opex + availability) for a vessel that can already burn the fuel, and an investment view (Layer 3) for a newbuild decision. Ammonia, methanol and LNG cannot be used in an existing VLSFO vessel without a new engine or major conversion; B30 is a drop-in subject to engine-maker approval.
A 15,000 TEU container ship sails laden from Shanghai to Rotterdam via Suez (10,500 nm at 16 knots; 25 MW average propulsion, 2 MW auxiliary, 36 h at each berth), requiring 64,306 GJ of useful energy, equivalent to about 114 t/day of VLSFO at sea. The voyage is extra-EU, so ETS and FuelEU cover 50% of voyage energy plus 100% of the EU berth stay [5][7]. Compliance year 2026; eight headhaul voyages a year; all inputs are listed in the workbook.
Why USD per tonne misleads
Figure 2 shows why USD per tonne misleads. At Base prices grey ammonia (USD 500/t) looks 40% cheaper than VLSFO (USD 850/t), yet the voyage needs 6,747 t of ammonia and pilot fuel against 3,137 t of VLSFO, so the fuel bill is about 40% higher. e-methanol costs 2.1 times VLSFO per tonne but 4.3 times per voyage. LNG is the opposite case: its high LHV means fewer tonnes, but its climate result depends on methane slip. Using the FuelEU default slip coefficients [7], a low-pressure Otto-cycle two-stroke (1.7% slip) has a WtW intensity of about 84 gCO₂e/MJ versus 76 for a high-pressure Diesel-cycle engine (0.2%), against 91 for VLSFO. The same slip penalty follows e-methane into an Otto engine.
Pathway matters as much as molecule. Grey methanol (natural-gas based, ~100 gCO₂e/MJ WtW) and grey ammonia (~124) are worse than VLSFO on a well-to-wake basis; blue ammonia depends on capture rates; bio- and e-fuels reach 10–17 gCO₂e/MJ only if certified under the relevant sustainability and RFNBO rules [7][17]. The B30 blend modelled (30% used-cooking-oil FAME) cuts WtW intensity by roughly a quarter, not to zero. Table 1 summarises the pathways; Figure 7 rates practical readiness.
The cost of carbon compliance
IMO
The 2023 GHG Strategy is an adopted but non-binding policy targeting net-zero emissions by or around 2050, with checkpoints of at least 20% (striving for 30%) by 2030 and 70% (striving for 80%) by 2040 versus 2008 [4]. EEXI and CII under MARPOL Annex VI are in force and constrain design and operations, but carry no direct carbon price. The LCA Guidelines define WtT, TtW and WtW boundaries but are guidelines, not obligations. The Net-Zero Framework, a fuel-intensity standard with Tier 1 and Tier 2 remedial units priced in the draft at USD 100 and USD 380 per tCO₂e for 2028–2030 [2][3], was approved at MEPC 83 but its adoption was adjourned in October 2025; MEPC 84 scheduled the resumed session for 4 December 2026, subject to confirmation at MEPC 85 [1]. At the cut-off it is therefore a proposal, not an enforceable obligation, and it is excluded from regulated costs here and used only as a shadow-price sensitivity.
European Union
The EU ETS covers ships of 5,000 GT and above: 100% of emissions between EU/EEA ports and at berth, 50% of voyages to or from non-EU ports, with 100% surrender from 2026 emissions and CH₄ and N₂O added in 2026 [5][6]. As a public, auction-based reference for the EUA level we use the Q3 2026 CBAM certificate price of EUR 82.32/t [8], converted at 1.154 USD/EUR [9]. FuelEU Maritime instead caps the WtW intensity of energy used on board, at 2% below the 91.16 gCO₂e/MJ reference to 2029, then 6% (2030), 14.5% (2035), 31% (2040), 62% (2045) and 80% (2050), with a penalty of EUR 2,400 per tonne of VLSFO-equivalent deficit, pooling, banking and borrowing, and a double reward for RFNBOs to 2033 [7]. The illustrative identity ‘compliance cost = covered emissions × price × coverage factor’ holds only for the ETS; FuelEU must be computed as an intensity balance. That is why grey ammonia carries almost no ETS cost (it emits no fossil CO₂ at the stack) yet a large FuelEU deficit, and why e-fuels can earn a saleable surplus. Both EU acts contain review clauses tied to any IMO global measure [6].
Freight-rate transmission and commercial implications
For pass-through we use: incremental freight cost per cargo unit = allocated incremental voyage cost ÷ cargo quantity carried. In the Base case VLSFO costs USD 248 per TEU on this voyage (all three layers); e-methanol costs USD 843, an increment of about USD 595 per TEU (USD 1,190 per FEU) at 100% allocation, or roughly a quarter of the Far East–North Europe spot rate of USD 2,313/TEU in the Shanghai Containerized Freight Index (SCFI) on 24 September 2026 [12][24]. A simple percentage method that scales the fuel bill by the price ratio would suggest only USD 234 per TEU, understating the increment about 2.5 times because it ignores the extra tonnage. For grey ammonia the naive method signals a saving while the framework shows a cost increase of USD 136 per TEU.
These are cost allocations, not freight forecasts. The SCFI composite, published weekly by the Shanghai Shipping Exchange, rose from 1,489 points in early March 2026 [23] to 2,985 by mid-June [21] and about 3,687 by late September [12]. Yet the Far East–North Europe lane climbed from USD 1,618/TEU in March [19] to USD 3,418 in early July [22], then fell to USD 2,313 by 24 September [13][12] while US-bound rates stayed near their highs. Every lane faced broadly the same fuel-cost shock, so the divergence reflects capacity and demand rather than fuel. Capacity cycles, blank sailings, canal routing, congestion and geopolitics dominate short-run rates; fuel and carbon costs reach cargo through bunker adjustment factors, ETS surcharges and charter clauses whose effect depends on market balance and bargaining power. Under time charters the charterer normally buys fuel, ETS allowances are allocated by contract, and FuelEU liability rests with the Document of Compliance holder [20]. A given fuel-price rise therefore does not imply an equal freight-rate rise.
Sensitivity, uncertainty and trade-offs
Figure 3 and Table 3 summarise the results. In the Base case effective cost is about USD 301/nm for VLSFO, USD 230–238/nm for fossil LNG, 335 for B30, 454–494 for grey and blue ammonia and grey methanol, 511 for e-methane, 698 for e-ammonia, 738 for bio-methanol and 1,018 for e-methanol. Five conclusions hold across all three scenarios.
- 1
At 2026 oil-linked prices, fossil LNG and VLSFO remain the cheapest per mile, while LNG’s advantage depends on low slip.
- 2
Every pathway with WtW intensity below about 40 gCO₂e/MJ of useful energy costs 1.4–3.9 times VLSFO; implied Base-case abatement costs versus VLSFO range from about USD 130/tCO₂e (B30) and 230 (e-methane) to 440 (e-ammonia) and 760 (e-methanol).
- 3
Fuel price dominates: a ±20% e-methanol price swing moves cost by about USD 350/TEU, while ±50% on the EUA price moves it by under USD 2.
- 4
For low-carbon fuels FuelEU is the larger regulatory lever: a sellable surplus worth roughly USD 0.8–0.9 million per voyage in the Base case, but only if a pool counterparty exists.
- 5
For fuels that need new engines, capex, fuel-system opex and availability add 2–13% of voyage cost; they rarely change rankings but strongly affect financing and route flexibility.
Rankings within the low-carbon group are not robust: e-ammonia and bio-methanol swap places between scenarios, and ammonia’s N₂O factor and availability remain the least certain inputs.
Future Outlook / Road Ahead
Three developments will shape the next benchmarking cycle. The 4 December 2026 IMO session will determine whether a global WtW price signal joins the EU instruments [1]; FuelEU’s step to a 6% reduction in 2030 will turn today’s small VLSFO deficit into a material cost [7]; and announced e-fuel capacity must become contracted, certified supply before availability premiums fall. Until then, the rational benchmark is not the cheapest tonne but the lowest risk-adjusted cost of a defined transport service, tested across scenarios and refreshed as prices, allowances and rules move.
Fuel decisions now require integrated cost, carbon, supply-chain and regulatory analysis rather than a single bunker-price indicator.
References
Publicly accessible; all accessed 13 October 2026. Research cut-off: 13 October 2026. Base year 2026, nominal USD, LHV basis. Companion files: editable Excel model and PowerPoint exhibits.
- [1]
IMO (2026). MEPC 84th session meeting summary, 27 Apr–1 May 2026. https://www.imo.org/en/mediacentre/meetingsummaries/pages/temporary-mepc-84th-session.aspx
- [2]
IMO (2025). IMO approves net-zero regulations for global shipping (MEPC 83). https://www.imo.org/en/mediacentre/pressbriefings/pages/imo-approves-netzero-regulations.aspx
- [3]
Vinson & Elkins (2025). IMO approves carbon credit scheme for shipping (remedial unit prices). https://www.velaw.com/insights/international-maritime-organization-approves-carbon-credit-scheme-for-shipping/
- [4]
IMO (2023). 2023 IMO Strategy on Reduction of GHG Emissions from Ships. https://www.imo.org/en/OurWork/Environment/Pages/2023-IMO-Strategy-on-Reduction-of-GHG-Emissions-from-Ships.aspx
- [5]
European Commission (2026). FAQ – Maritime transport in the EU ETS. https://climate.ec.europa.eu/eu-action/transport-decarbonisation/reducing-emissions-shipping-sector/faq-maritime-transport-eu-emissions-trading-system-ets_en
- [6]
EMSA (2026). ETS extension to maritime. https://www.emsa.europa.eu/reducing-emissions/extension-ets.html
- [7]
EUR-Lex. Regulation (EU) 2023/1805 (FuelEU Maritime). https://eur-lex.europa.eu/eli/reg/2023/1805/oj
- [8]
European Commission DG TAXUD (5 Oct 2026). Price of CBAM certificates. https://taxation-customs.ec.europa.eu/carbon-border-adjustment-mechanism/price-cbam-certificates_en
- [9]
Banca d’Italia (16 Sep 2026). ECB euro reference rates. https://www.bancaditalia.it/compiti/operazioni-cambi/cambio/cambi_rif_20260916
- [10]
ENGINE (1 Oct 2026). Singapore prices decline across all bunker fuel grades. https://www.engine.online/news/singapore-prices-decline-across-all-bunker-fuel-grades-8216
- [11]
ENGINE (9 Oct 2026). Singapore’s B30-VLSFO and HSFO prices increase. https://www.engine.online/news/singapores-b30-vlsfo-and-hsfo-prices-increase-vlsfo-and-lsmgo-fall-827e
- [12]
Sourcing Center (24 Sep 2026), citing Liberty Times Finance: SCFI 3,686.62; Far East–North Europe USD 2,313/TEU (Shanghai Shipping Exchange data). https://sourcing.center/news/2026-09-24-scfi-ends-eight-week-streak-europe-soft-se-asia-up
- [13]
Rynda (11 Sep 2026). SCFI rises for the seventh week; Asia–Europe softens (Shanghai Shipping Exchange data). https://rynda.io/news/c5fbfc34-6d56-4a73-9c04-238f353b1efe
- [14]
UNCTAD (10 Mar 2026). Strait of Hormuz: rapid assessment. https://unctad.org/system/files/official-document/osgttinf2026d1_en.pdf
- [15]
IRENA (2021). Innovation Outlook: Renewable Methanol. https://www.irena.org/publications/2021/Jan/Innovation-Outlook-Renewable-Methanol
- [16]
IRENA (2022). Innovation Outlook: Renewable Ammonia. https://www.irena.org/publications/2022/May/Innovation-Outlook-Renewable-Ammonia
- [17]
EUR-Lex. Directive (EU) 2018/2001 (RED II), Annex V. https://eur-lex.europa.eu/eli/dir/2018/2001/oj
- [18]
Ship & Bunker. World bunker prices (public page; grey methanol, early 2026). https://shipandbunker.com/prices
- [19]
SunSirs (17 Mar 2026). SCFI 13 Mar 2026: 1,710.35; Far East–Europe USD 1,618/TEU (Shanghai Shipping Exchange data). https://www.sunsirs.com/commodity-news/petail-31324.html
- [20]
Thommessen. FuelEU Maritime regulation database (pooling, BIMCO clause, DoC-holder responsibility). https://www.thommessen.no/en/sustainability/database/regulation/fueleu-maritime
- [21]
Xinde Marine News (14 Jun 2026). SCFI nears 3,000 points (24 Apr and 12 Jun 2026 readings). https://www.xindemarinenews.com/news/2066186264513871873
- [22]
BigGo Finance (Jul 2026). SCFI rises for tenth straight week to 3,326.87; Far East–Europe USD 3,418/TEU. https://finance.biggo.com/news/7b394248-5668-4832-81c4-76aa829c5bd6
- [23]
Cello Square / Samsung SDS (Mar and May 2026). Logistics market intelligence reports: SCFI week 10 (1,489) and week 19 (1,954). https://www.cello-square.com/en/marketupdates/view-2183.do
- [24]
Container News. SCFI description: Shanghai Shipping Exchange, launched Oct 2009; units USD/TEU (USD/FEU for US coasts). https://container-news.com/scfi/
Methodology note:proprietary and subscription sources (Argus, S&P Global Platts, CRISIL, ICIS, Drewry, Xeneta, Lloyd's List) were not used; freight observations use the SCFI, an exchange index published by the Shanghai Shipping Exchange. Prices for LNG, methanol, ammonia and e-fuels are modelled scenario values, not quotations. Full assumptions, formulas and quality checks are in the companion Excel workbook.
Decarbonisation analytics and carbon-aware commodity economics
EnviroSusIQ supports this shift with decarbonisation analytics and carbon-aware commodity economics. The transparent, source-traceable model behind this article can be adapted to a client’s own vessels, routes, contracts and price data.
Comparative fuel and commodity cost modelling
Cost benchmarking across alternative production and supply pathways
Scenario-based forecasting and sensitivity analysis
Carbon-intensity and emissions-adjusted economic assessment
Supply-demand and procurement intelligence
Decision-support analytics for companies moving to lower-carbon fuels and materials
To discuss a tailored benchmark, visit EnviroSusIQ – https://www.envirosusiq.com/.
Benchmarking your fleet’s fuel choice?
ESIQ adapts this effective-cost model to your vessels, routes, contracts and price data.
Continue the research

What Does Green Ammonia Really Cost?
A bottom-up analysis of green ammonia production costs, carbon intensity and the economics of competing low-carbon ammonia pathways.
Read More →
The Ageing Tanker Fleet: Why Decarbonisation Could Tighten Global Freight Markets
How fleet renewal, shipyard constraints, alternative fuels and decarbonisation rules could tighten tanker supply and reshape global freight markets.
Read More →
Marine Shipping Decarbonisation
Navigating the transition to low-carbon shipping - the regulations, fuels, infrastructure and freight economics reshaping global trade.
Read More →