
What Does Green Ammonia Really Cost?
A Bottom-Up Cost Model and Carbon Benchmark for Low-Carbon Ammonia
Published figures for green ammonia span several hundred to several thousand dollars per tonne, and they are rarely comparable. This article applies a transparent, bottom-up EnviroSusIQ cost model and a common cradle-to-gate carbon benchmark to grey, blue, green and grid-electrolytic ammonia – and tests what it would take for green ammonia to compete.
Base-case green ammonia costs USD 1,373/t NH₃ at the plant gate (USD 1,460/t delivered to north-west Europe), against USD 270/t for grey.
Electricity is 38% of green cost and financing 29%; electrolyser CAPEX, power cost, WACC and capacity factor dominate the sensitivity.
Green reaches 0.30 tCO₂e/t, below the indicative 0.52 t/t level; Blue-B (0.59) and Blue-A (1.05) sit above it at Base, and grid electrolysis (4.29) is more than twice grey.
Green abates at about USD 632/tCO₂e versus USD 92 for Blue-B; the Q3 2026 CBAM certificate price closes the Blue-B gap but leaves green about USD 940/t short.
The cheapest power does not automatically produce the cheapest ammonia – financing and utilisation can absorb much of a site's advantage.
Why green ammonia cost claims need a bottom-up economic test
Published figures for green ammonia span several hundred to several thousand dollars per tonne, and they are rarely comparable. Some are project targets, some are production-cost estimates for the best sites, and some mix plant-gate costs with delivered prices. The International Energy Agency (IEA) expects fossil-based hydrogen production to remain cheaper than renewable hydrogen in most regions in the near term [1], and it reports installed electrolyser costs of USD 2,000–2,600/kW outside China in 2024, against USD 600–1,200/kW in China [2]. A decision-grade answer needs an explicit boundary, a defined plant and a common functional unit.
This article applies that test using a transparent EnviroSusIQ model. The functional unit is one tonne of anhydrous NH₃ at the plant gate in real 2026 US dollars, for an illustrative 1,500 t/day plant with a 25-year life. Delivered cost to a north-west European importer is reported separately. Emissions are cradle-to-gate in tCO₂e/t NH₃ using 100-year global warming potentials (GWP100). Two terms are kept distinct: green describes a production pathway, while low-carbon describes an emissions outcome, and qualification under either label depends on the applicable rules [3][4][5]. Results in this article are scenario outputs, not market quotations or certified values.
The components that determine green ammonia cost
Figure 1 shows the model structure. Hydrogen demand starts from stoichiometry: 3H₂ + N₂ → 2NH₃ gives 0.1776 t H₂/t NH₃ with standard molar masses. The model assumes 0.180 t/t, an EnviroSusIQ allowance of about 1.4% for purge and recycle losses. The Haber–Bosch (HB) plant runs at an 85% annual load factor, giving 1,500 × 365 × 0.85 = 465,375 t/yr of NH₃. The electrolyser consumes 52 kWh/kg at beginning of life, raised by 3% to a life-average 53.56 kWh/kg; this degradation adjustment is applied to both electricity use and electrolyser sizing.
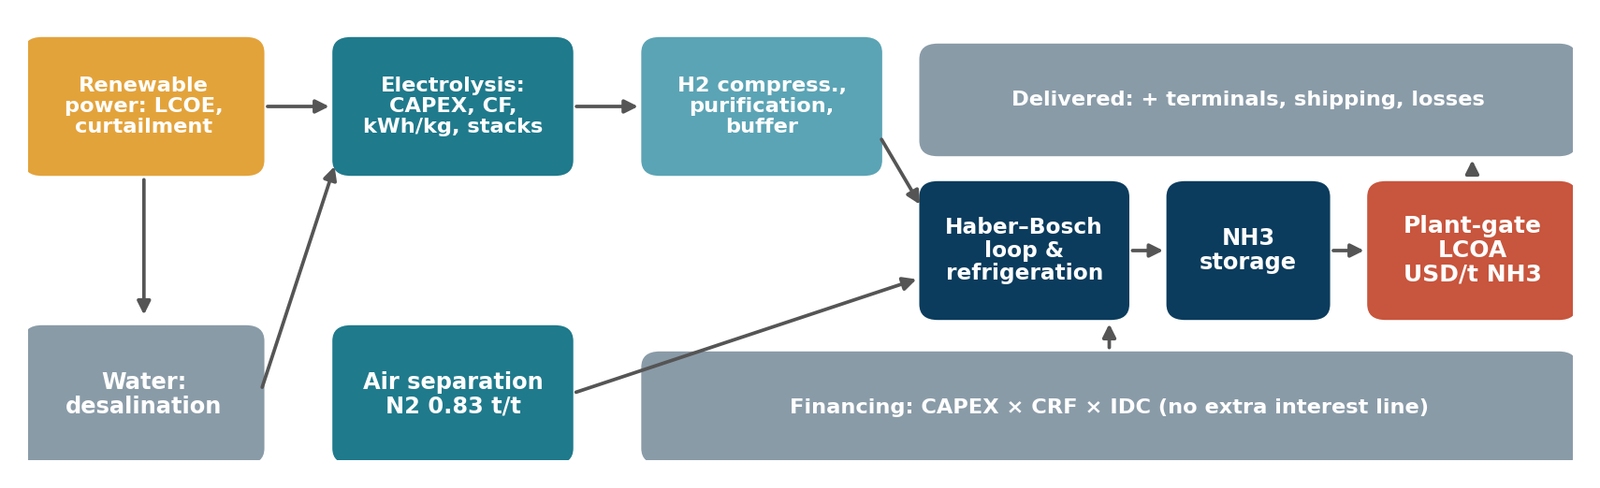
The core equations use unrounded workbook inputs (CF is the electrolyser capacity factor, r the real weighted average cost of capital or WACC, n the 25-year life and c the 3-year construction period):
LCOA is the levelised cost of ammonia, CRF the capital recovery factor and IDC an interest-during-construction factor that approximates an even three-year drawdown (within about 0.2% of a mid-year schedule). The delivered electricity price combines a USD 40/MWh hybrid solar–wind levelised cost, consistent with IRENA's 2024 global weighted averages of USD 34/MWh for onshore wind and USD 43/MWh for solar PV [6], 7% curtailment and a USD 6/MWh balancing adder. Because this is a power-purchase-agreement (PPA) equivalent price, renewable generation CAPEX is not added again. The electrolyser installed cost of USD 2,000/kW sits at the bottom of the IEA range for outside China and includes engineering, procurement and construction (EPC) [2]. A 15% owner's-cost and contingency allowance is applied to the other equipment: hydrogen compression and buffer storage, the air separation unit (ASU) for nitrogen, the HB loop with its balance of plant (BoP), and NH₃ storage.
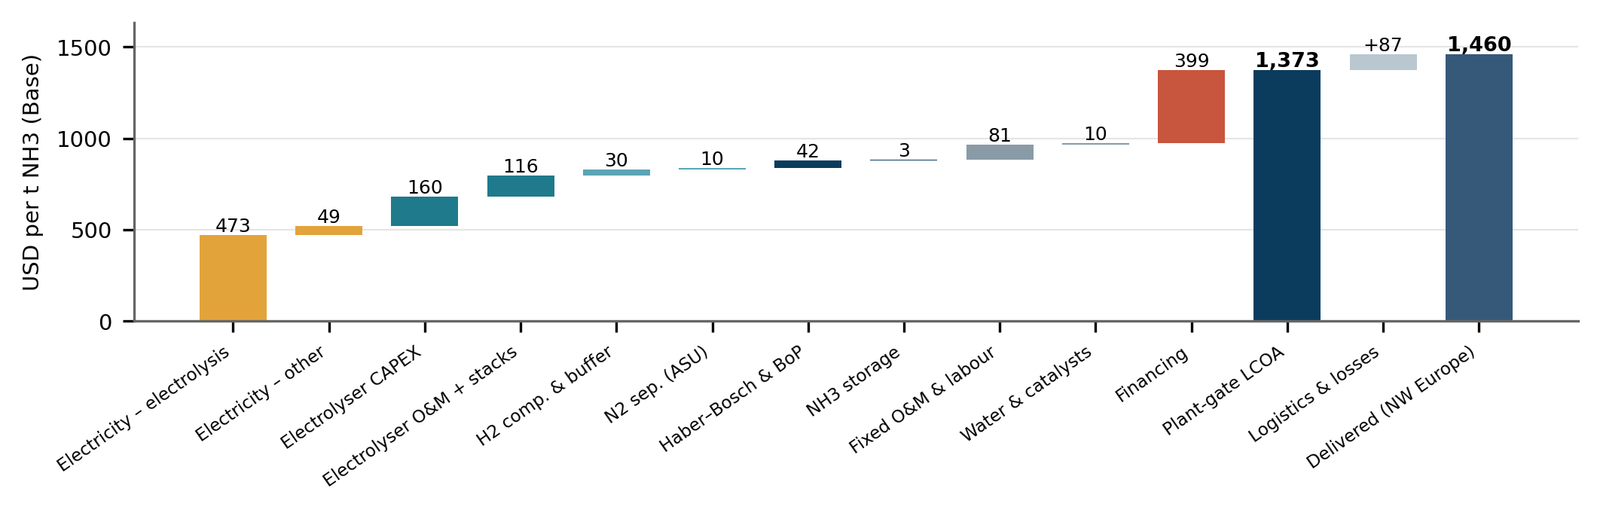
Total overnight CAPEX is USD 2.85 billion: USD 1.86 billion for the electrolyser and USD 0.99 billion for everything else. The annual capital charge (CAPEX × CRF × IDC) is USD 644/t. The cost bridge splits this into straight-line depreciation of each asset (USD 245/t in total, of which the electrolyser is USD 160/t) and a single financing line of USD 399/t covering return on capital and IDC. No separate interest is added, so financing is neither omitted nor double counted. Electrolyser fixed O&M and stack replacement (accrued per operating hour) add USD 116/t. This simplified levelised method is not a project-finance model; debt sculpting, tax and policy revenue would change the results. Table 1 lists the main inputs.
The Base result is USD 1,373/t NH₃ at the plant gate (Figure 2). Electricity is 38% of cost, financing 29% and electrolyser depreciation, O&M and stacks a further 20%; nitrogen separation, synthesis and storage depreciation together add about USD 55/t. This is consistent with IRENA's 2022 estimate of USD 720–1,400/t for new renewable ammonia plants [7]. Export terminal, shipping, import terminal and losses (EnviroSusIQ assumptions within IRENA's USD 45–100/t shipping range [7]) bring the delivered cost to USD 1,460/t.
Costs, emissions and key assumptions
All pathways use the same cradle-to-gate boundary: direct plant emissions after capture, electricity, upstream gas including methane, and other upstream materials. No credits are taken for urea CO₂ use or steam export. Grey ammonia from a steam methane reformer (SMR) using 30 GJ/t of gas (IEA best available technology is 28 GJ/t [11]) costs USD 270/t at USD 4/MMBtu, close to a published US estimate of about USD 230/t [12]. Its direct emissions are 30 GJ × 0.0561 tCO₂/GJ = 1.68 t/t, in line with about 1.8 t/t for best-available SMR [13]. Adding 0.06 t/t from grid electricity (0.15 MWh/t at 0.4 t/MWh) and 0.30 t/t of upstream gas emissions gives 2.04 tCO₂e/t, near IRENA's figure of roughly 2.2 including upstream [7].
Blue ammonia is not one product. About two-thirds of SMR CO₂ is in the concentrated process stream [7][14]. Capturing 95% of that stream (Blue-A) removes about 62% of direct CO₂ in this model, but cuts cradle-to-gate emissions only by about half, to 1.05 t/t. An autothermal reformer (ATR) with full capture (Blue-B) is modelled at 95% of direct CO₂, inside the 93–98% design range [10]. The IEA notes that high-capture CCUS-based hydrogen production has yet to be demonstrated [15], so this is a design assumption. Blue-B reaches 0.59 t/t, of which only 0.09 t is residual direct CO₂; upstream methane (0.32 t) and power (0.18 t) dominate the rest.
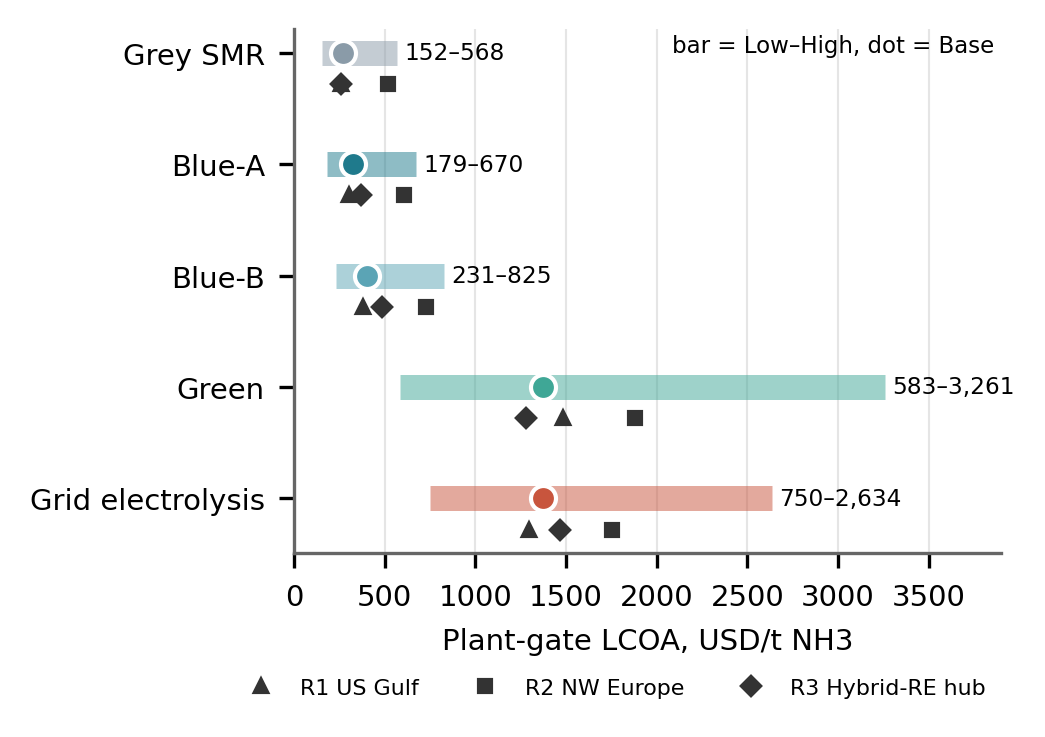
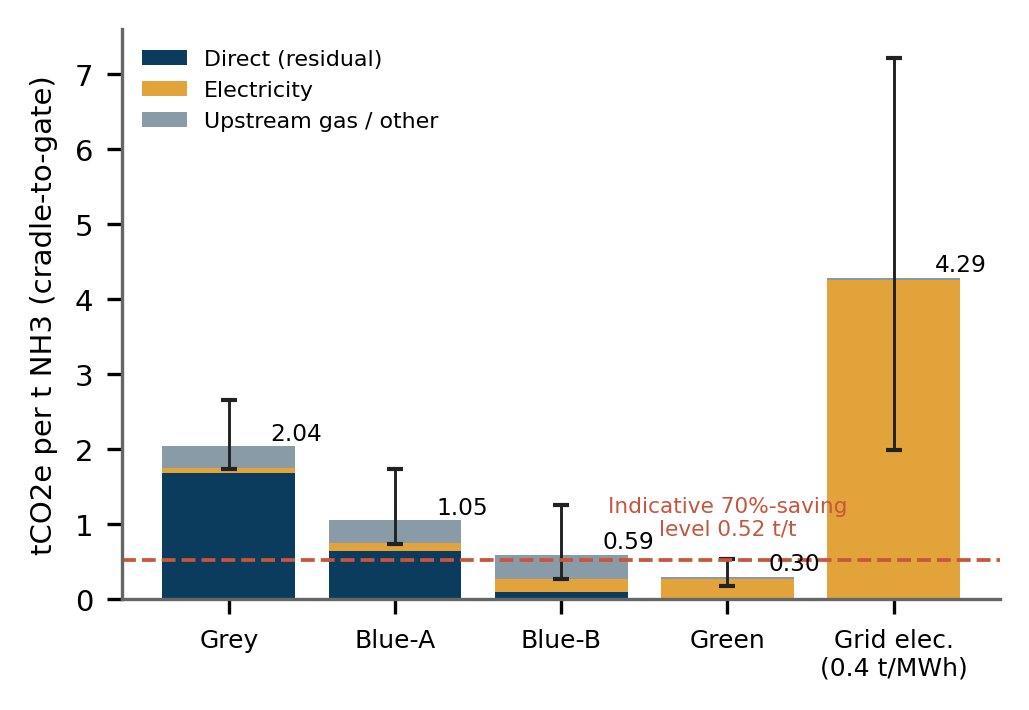
Electrolytic does not automatically mean low-carbon. The grid case holds the HB plant and output constant and resizes the electrolyser to a 95% CF. On a grid emitting 0.4 tCO₂/MWh, 10.645 MWh/t gives 4.26 t/t, plus 0.03 t/t of other upstream emissions, for 4.29 t/t, more than twice grey; a much cleaner grid or hourly-matched clean supply would change this. EU renewable fuels of non-biological origin (RFNBOs) must meet additionality, geographic-correlation and temporal-correlation rules, with monthly matching to the end of 2029 and hourly matching from 2030 [3]. They must also achieve a 70% saving against a 94 gCO₂e/MJ comparator [4], and a parallel 70% test applies to low-carbon fuels including blue [5]. Using ammonia's lower heating value (LHV) of 18.6 GJ/t, 94 × 0.30 × 18.6 ÷ 1,000 gives an indicative 0.5245 tCO₂e/t. At Base, Blue-A (1.05) and Blue-B (0.59) are above it; green (0.30) is below it, but only marginally above (0.53) in the High case because of the lifecycle emissions of renewable power, which the RFNBO method counts as zero for directly connected supply. This simplified screen is not a certification determination.
Energy-equivalent, hydrogen-equivalent and CO₂ abatement cost
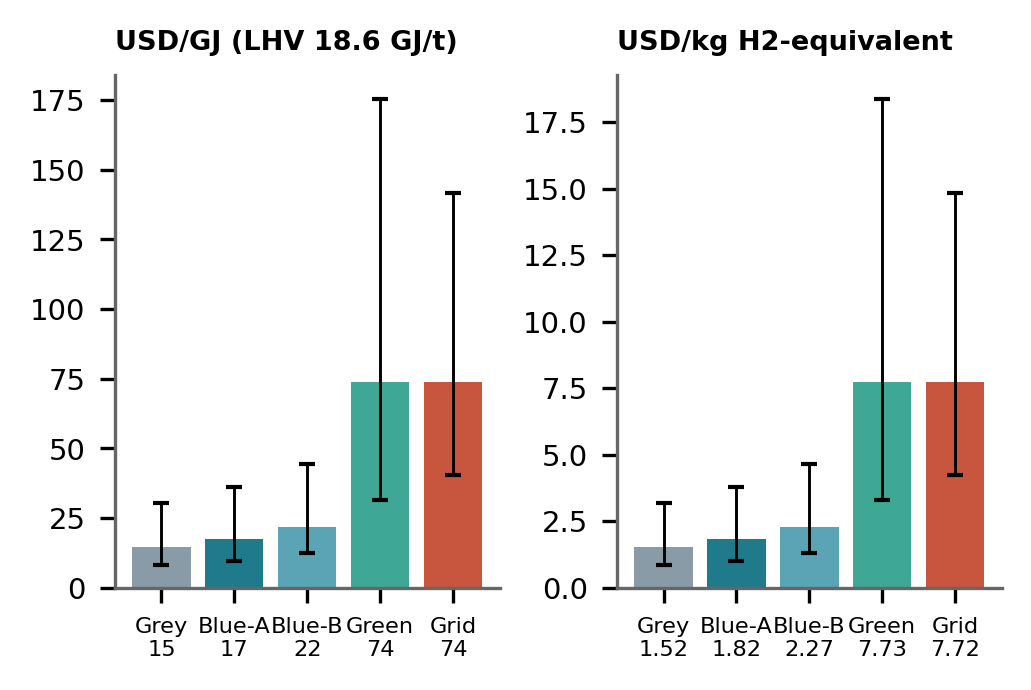
USD/GJ divides LCOA by the 18.6 GJ/t LHV: green is USD 74/GJ against USD 15/GJ for grey. This compares chemical energy only, not end-use performance. USD/kg H₂-equivalent divides LCOA by the theoretical 0.1776 t H₂/t: green equals USD 7.73/kg and grey USD 1.52/kg (Figure 5). This is a theoretical feedstock equivalence, not a delivered-hydrogen cost; cracking ammonia back to hydrogen requires additional energy, equipment and purification, which are not modelled. Cost of CO₂ avoided compares each pathway with grey in the same scenario, using plant-gate costs and cradle-to-gate emissions. It is reported as undefined when emissions are not lower (Figure 6):
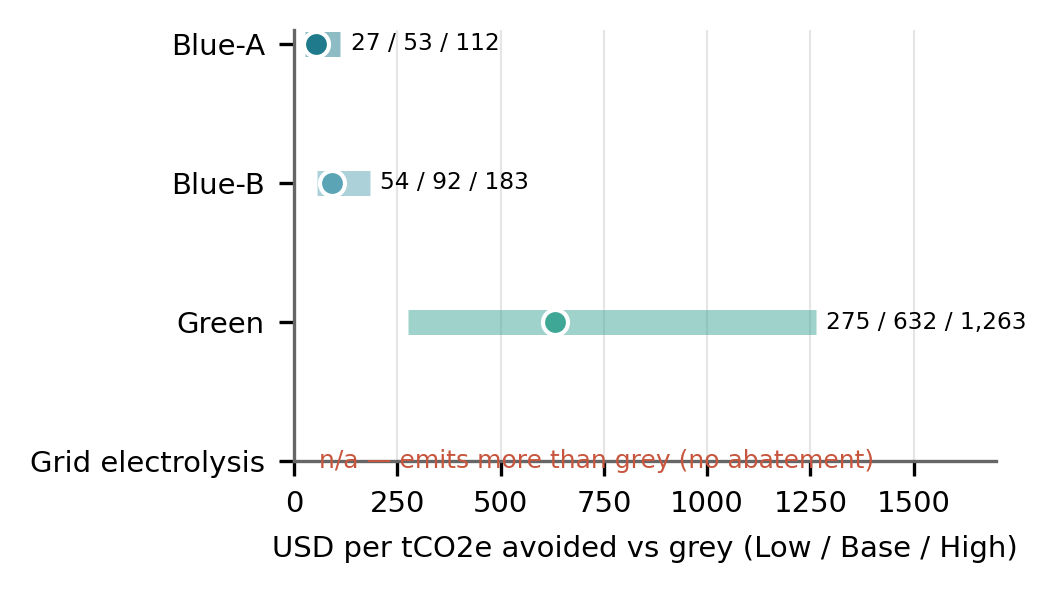
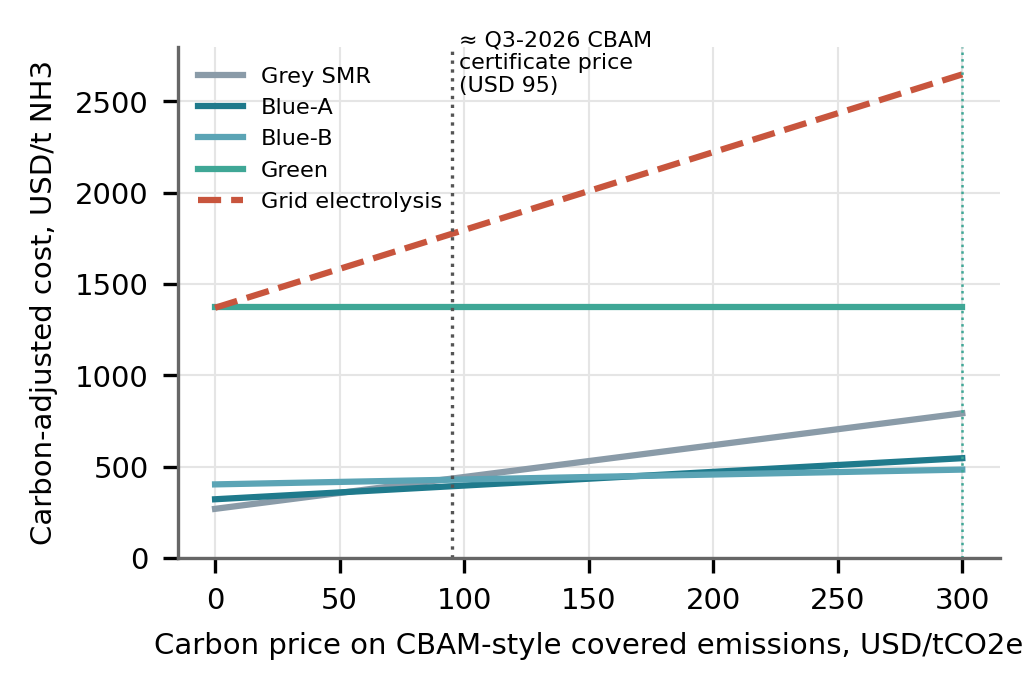
Rounding the inputs to 1,373, 270, 2.04 and 0.30 gives about USD 634; the unrounded workbook value is USD 632. Blue-A abates at USD 53/tCO₂e (27–112), Blue-B at USD 92 (54–183) and green at USD 632 (275–1,263); grid electrolysis abates nothing. Blue looks cheap per tonne avoided, but Blue-A avoids only about 1.0 t/t. A carbon-price break-even depends on which emissions an instrument actually prices. The EU Emissions Trading System (ETS) covers direct installation emissions. The Carbon Border Adjustment Mechanism (CBAM) prices imported fertilisers, including ammonia, on both direct and indirect electricity emissions [16][17], with obligations adjusted for EU free allocation during the 2026–2034 phase-in [16]. Neither prices upstream methane. On CBAM-style coverage, green breaks even with grey at about USD 633/tCO₂e and Blue-B at USD 91; on ETS-style coverage, the figures are USD 656 and USD 84 (Figure 8). A direct-only price would even favour grid electrolysis despite its higher lifecycle emissions, which shows why coverage matters. The Q3 2026 CBAM certificate price of EUR 82.32 [18], about USD 95 at 1.1537 USD/EUR [19], closes the Blue-B gap but leaves green about USD 940/t short. These break-evens are full-price shadow indicators, not liability estimates.
Electricity, utilisation, financing, carbon price and regional differences
The tornado in Figure 7 varies one input at a time between its Low and High values, holding everything else at Base. Electrolyser CAPEX (USD 430/t swing), renewable electricity cost (401), WACC (328) and electrolyser CF (317) dominate. Efficiency, BoP CAPEX, HB load factor, curtailment, stacks and water each move LCOA by about USD 100/t or less. With USD 20/MWh power and a 70% CF, Base green ammonia still costs about USD 1,030/t, 3.8 times Base grey.
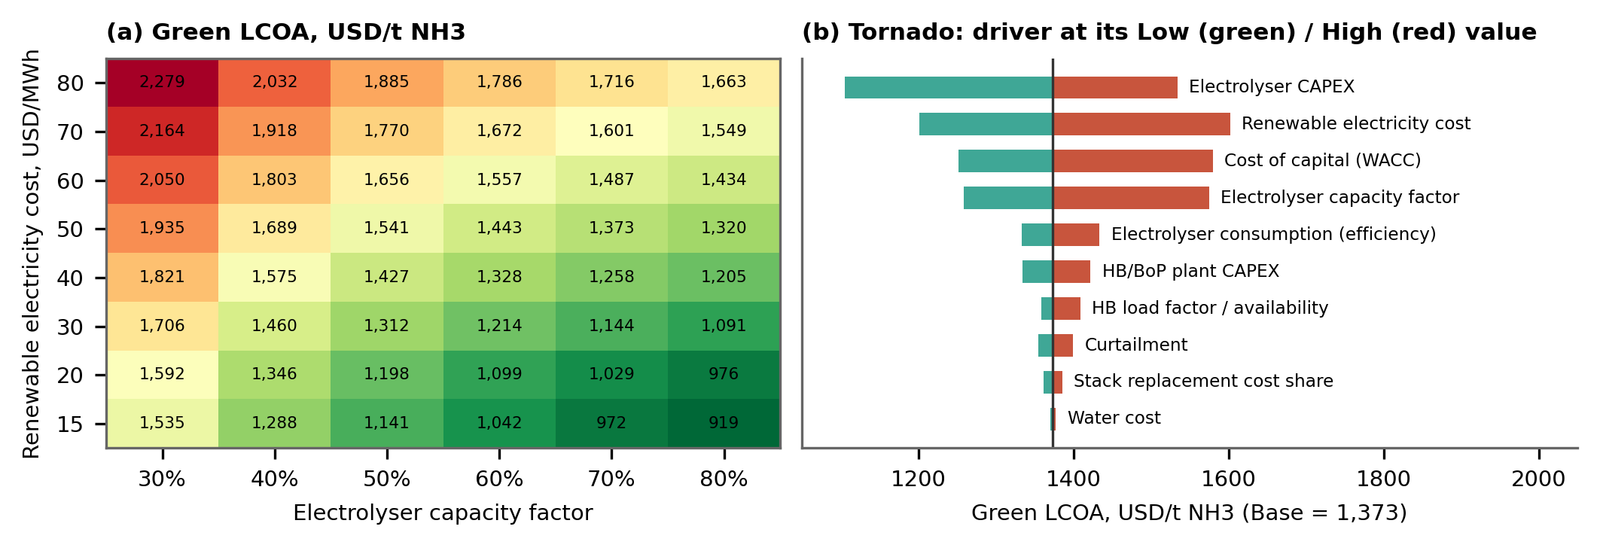
The cheapest power does not automatically produce the cheapest ammonia. In the illustrative regional cases, a hybrid-renewables export hub with USD 28/MWh power and a 65% CF reaches USD 1,276/t, only 7% below Base, because an assumed 10% WACC absorbs much of the advantage. A US Gulf Coast case (USD 42/MWh, 45% CF, 7.5% WACC) reaches USD 1,481/t and a north-west European case (USD 65/MWh, 40% CF) USD 1,881/t. Gas prices move the other side of the comparison. At the 2025 Title Transfer Facility (TTF) average of USD 11.96/MMBtu [9], the European case puts grey at USD 518/t. At September 2026's monthly TTF average of USD 25.42/MMBtu [9], Base grey would cost about USD 930/t, still below green. IRENA's 2022 estimate that about USD 150/tCO₂ would make renewable ammonia competitive [7] assumed best-site costs and higher 2022 gas prices, which is why it is far below this model's Base break-even.
Future Outlook / Road Ahead
On this model, green ammonia in 2026 costs roughly four to six times grey at the plant gate, with a Base abatement cost of about USD 630/tCO₂e. High-capture blue routes abate far more cheaply, but whether they fall below low-carbon thresholds depends on measured upstream methane and power supply, and on capture performance that is still to be demonstrated at scale. Four variables will shift these numbers: whether electrolyser costs outside China converge towards Chinese levels [2]; renewable power cost and achievable utilisation; financing costs, which depend on bankable offtake and policy; and how strictly regulators apply temporal matching and methane accounting [3][5]. In the United States, the Section 45V hydrogen credit applies only to facilities beginning construction before 1 January 2028 [20]. It is paid per kilogram of hydrogen in four lifecycle-emissions tiers, from USD 3.00/kg below 0.45 kgCO₂e/kg H₂ (with labour requirements met) to USD 0.60/kg at 2.5–4 kg, assessed with the 45VH2-GREET model [21], so not every ammonia project qualifies for the full value.
Buyers and investors should test any ammonia offer against an explicit boundary, emissions basis and scenario range rather than a single headline price.
References
Publicly accessible; all accessed 13 October 2026. Research cut-off: 13 October 2026. Real 2026 USD, plant gate unless stated, lower-heating-value basis. Figures are EnviroSusIQ model outputs unless attributed.
- [1]
IEA (2026). Global Hydrogen Review 2026 – Production. https://www.iea.org/reports/global-hydrogen-review-2026/production
- [2]
IEA (Sep 2025). Global Hydrogen Review 2025 – Executive summary. https://www.iea.org/reports/global-hydrogen-review-2025/executive-summary
- [3]
EUR-Lex (Jun 2023). Commission Delegated Regulation (EU) 2023/1184 – RFNBO rules. https://eur-lex.europa.eu/eli/reg_del/2023/1184/oj
- [4]
EUR-Lex (Jun 2023). Commission Delegated Regulation (EU) 2023/1185 – RFNBO GHG methodology. https://eur-lex.europa.eu/eli/reg_del/2023/1185/oj
- [5]
EUR-Lex (Jul 2025). Commission Delegated Regulation (EU) 2025/2359 – low-carbon fuels methodology. https://eur-lex.europa.eu/eli/reg_del/2025/2359/oj/eng
- [6]
IRENA (Jul 2025). Renewable Power Generation Costs in 2024 – Summary. https://www.irena.org/-/media/Files/IRENA/Agency/Publication/2025/Jul/IRENA_TEC_RPGC_in_2024_Summary_2025.pdf
- [7]
IRENA & Ammonia Energy Association (May 2022). Innovation Outlook: Renewable Ammonia. https://www.irena.org/-/media/Files/IRENA/Agency/Publication/2022/May/IRENA_Innovation_Outlook_Ammonia_2022.pdf
- [8]
Sustainability (MDPI) 15(2):1623 (2023). Ammonia production from clean hydrogen and implications for global natural gas demand. https://dx.doi.org/10.3390/su15021623
- [9]
World Bank (2 Oct 2026). Commodity Markets Pink Sheet, October 2026. https://thedocs.worldbank.org/en/doc/74e8be41ceb20fa0da750cda2f6b9e4e-0050012026/related/CMO-Pink-Sheet-October-2026.pdf
- [10]
Ammonia Energy Association. Technology options for low-emission ammonia production from gas. https://ammoniaenergy.org/articles/technology-options-for-low-emission-ammonia-production-from-gas
- [11]
IEA (Oct 2021). Ammonia Technology Roadmap. https://www.iea.org/reports/ammonia-technology-roadmap
- [12]
AIChE Annual Meeting 2025, proceedings abstract. Boosting US ammonia (conventional NH3 minimum selling price). https://proceedings.aiche.org/conferences/aiche-annual-meeting/2025/proceeding/paper/boosting-us-ammonia
- [13]
IEAGHG / ICEF (2023). Low-Carbon Ammonia Roadmap (insight paper 2023-IP03). https://publications.ieaghg.org/insightpapers/2023-IP03%20Low-Carbon%20Ammonia%20Roadmap.pdf
- [14]
Ontario Energy Board public filing (record 786128). Life-cycle GHG emissions of blue hydrogen. https://www.rds.oeb.ca/CMWebDrawer/Record/786128/File/document
- [15]
IEA (2026). Global Hydrogen Review 2026 – Investment and innovation. https://www.iea.org/reports/global-hydrogen-review-2026/investment-and-innovation
- [16]
EUR-Lex (May 2023). Regulation (EU) 2023/956 – Carbon Border Adjustment Mechanism. https://eur-lex.europa.eu/eli/reg/2023/956/oj
- [17]
European Commission, Customs & Taxation EU Learning. CBAM in the fertilisers sector – course takeaways. https://customs-taxation.learning.europa.eu/pluginfile.php/43945/mod_resource/content/1/CBAM%20in%20the%20Fertilisers%20Sector%20-%20Course%20Takeaways_EN_updated_p6_clean.pdf
- [18]
European Commission DG TAXUD (5 Oct 2026). Price of CBAM certificates. https://taxation-customs.ec.europa.eu/carbon-border-adjustment-mechanism/price-cbam-certificates_en
- [19]
Banca d’Italia (16 Sep 2026). ECB euro foreign exchange reference rates. https://www.bancaditalia.it/compiti/operazioni-cambi/cambio/cambi_rif_20260916
- [20]
Pierce Atwood (Jul 2025). Congress phases out energy tax credits (45V construction deadline). https://www.pierceatwood.com/alerts/congress-phases-out-energy-tax-credits
- [21]
ICCT (Apr 2025). Final regulations for the Section 45V clean hydrogen production tax credit. https://theicct.org/wp-content/uploads/2025/04/ID-337-–-Hydrogen-credit_policy-update_final.pdf
Methodology note:all costs, emissions and break-evens are EnviroSusIQ scenario outputs unless attributed. They are not market quotations, project targets or certified values, and the model has passed internal reconciliation checks but has not been independently verified. Subscription price services (Argus, S&P Global, CRISIL, ICIS) were not used. Abbreviations: CCUS = carbon capture, utilisation and storage; MMBtu = million British thermal units; O&M = operation and maintenance; T&S = transport and storage.
Decision-grade ammonia and hydrogen economics
EnviroSusIQ supports these decisions with bottom-up green hydrogen and ammonia cost modelling, renewable-power and electrolyser sensitivities, grey/blue/green benchmarking, lifecycle-emissions analysis, abatement-cost and carbon-price break-even assessment, and regional and export economics. The transparent model behind this article can be adapted to a specific site, contract structure or data set.
Bottom-up green hydrogen and ammonia cost modelling
Renewable-power and electrolyser sensitivities
Grey/blue/green benchmarking and lifecycle-emissions analysis
Abatement-cost and carbon-price break-even assessment
Regional and export economics
To discuss a tailored benchmark for your project or procurement strategy, visit EnviroSusIQ – https://www.envirosusiq.com/.
Benchmarking a low-carbon ammonia offer?
ESIQ adapts this model to your site, contract structure or data set – with an explicit boundary, emissions basis and scenario range.
Continue the research
From Bunkering Cost to Carbon Cost
How shipping fuel economics are changing as carbon costs, maritime regulation and alternative fuels reshape the true cost of bunkering.
Read More →
Can Catalyst Innovation Change the Economics of Low-Carbon Ammonia – not Merely Improve the Chemistry?
How catalyst innovation and process design could reshape green ammonia costs, carbon competitiveness and emerging low-carbon ammonia markets.
Read More →
The Future of Urea Manufacturing
How ageing plants, technology upgradation, Industry 5.0 and cost pressures are shaping the future of low-carbon urea manufacturing.
Read More →