
Can Catalyst Innovation Change the Economics of Low-Carbon Ammonia – not Merely Improve the Chemistry?
From Advanced Catalysts and Process Innovation to Green Ammonia Costs, Carbon Competitiveness and Emerging Markets
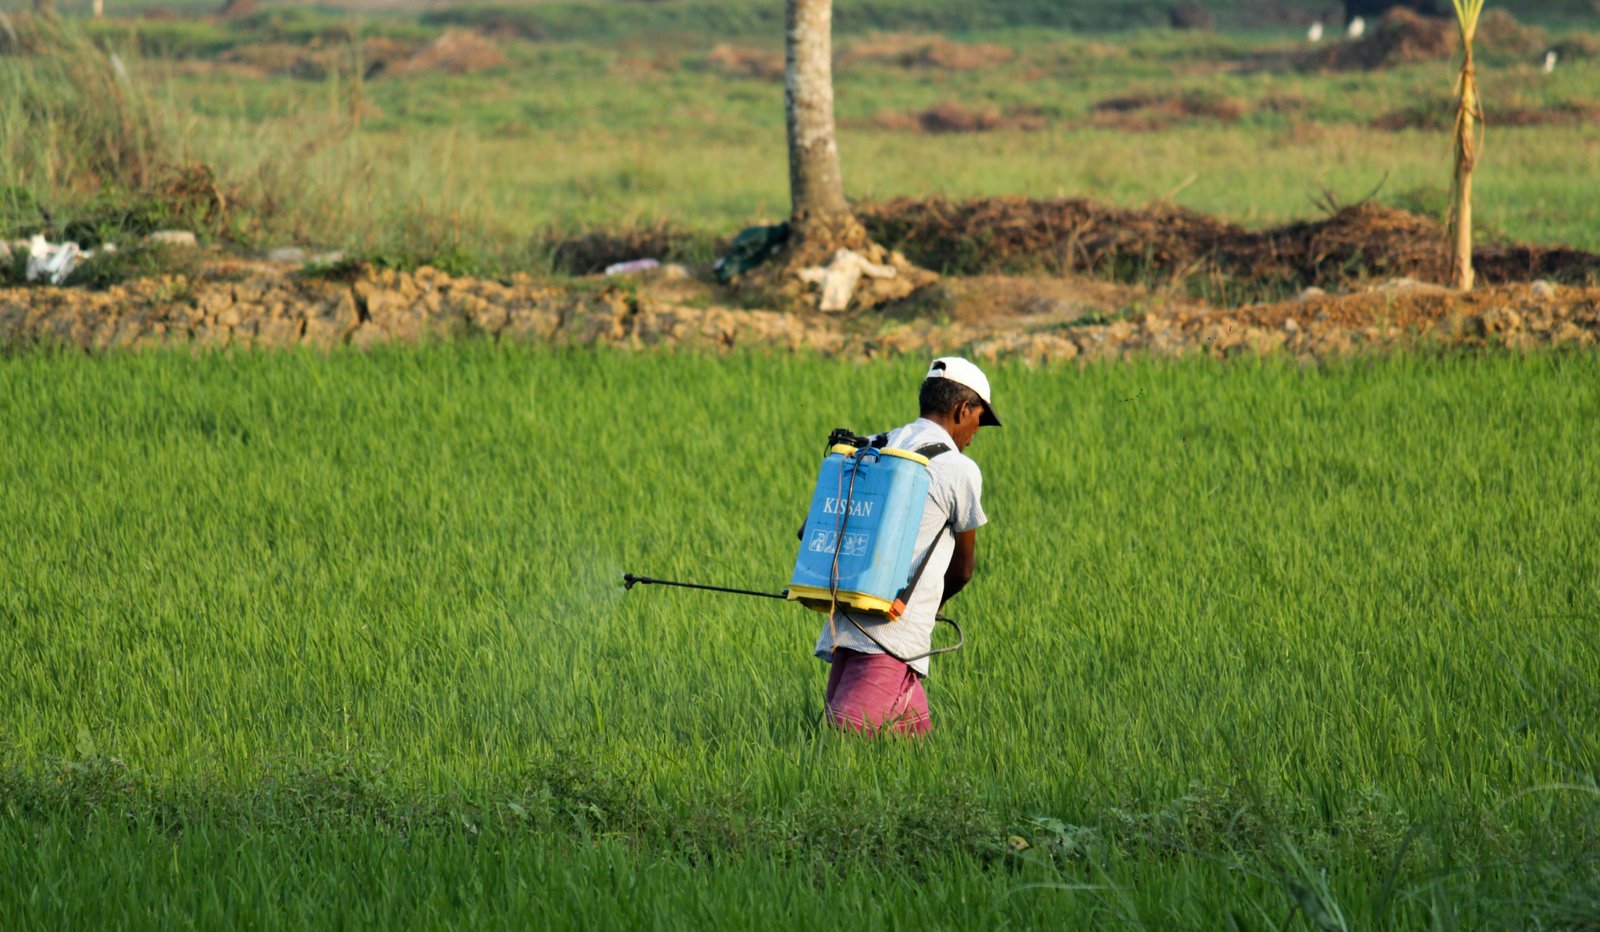
Ammonia is the starting point for almost every mineral nitrogen fertiliser: around 70% of output is used to make fertilisers, with the balance going into plastics, explosives, fibres and other industrial chemistry (IEA, 2021). It is also attracting interest beyond agriculture. Because ammonia is 17.6% hydrogen by mass and liquefies at about −33 °C at atmospheric pressure, it is being evaluated as a hydrogen carrier for trade, a fuel for power generation and a potential zero-carbon marine fuel.
The climate cost is significant. Ammonia production accounts for roughly 2% of global final energy use and about 450 Mt of direct CO₂ a year, equivalent to around 2.4 t CO₂ per tonne of ammonia on a global-average basis (IEA, 2021). The Haber-Bosch process that makes it is more than a century old and extremely well optimised. Its limitation is less the chemistry than the operating model it imposes: continuous, high-temperature, high-pressure, very large plants fed by cheap fossil hydrogen.
New catalysts promise milder operating conditions, smaller and more flexible plants, and even direct electrified synthesis. The commercial question, however, is broader than catalyst activity. This article asks whether catalyst innovation can materially change the cost, carbon intensity and flexibility of ammonia production, or whether hydrogen and electricity economics will continue to decide the outcome. The chain we test is shown in Infographic 1.
Infographic 1. From catalyst innovation to ammonia economics. Evidence becomes weaker the further left a claim sits; commercial conclusions need plant-level data.
Ammonia production emits about 450 Mt of direct CO₂ a year – around 2.4 t CO₂ per tonne – and Haber-Bosch's limitation is its operating model more than its chemistry.
Improved thermocatalysts (ruthenium, electride-supported Ru) are commercial or early commercial; electrochemical, plasma and photocatalytic routes remain at laboratory or bench stage.
In the illustrative green base case, combined catalyst benefits save about USD 20–75/t (2–9%), while cheaper electricity or electrolysers each save about USD 150/t.
A USD 100/t CO₂ price narrows the green premium, but green ammonia matches grey only with low-cost electrolysers and electricity below about USD 25/MWh.
Catalysts change economics at the margin, and more significantly by enabling flexible, smaller plants; the outcome depends on hydrogen, electricity, plant design, carbon intensity and demand together.
The Catalyst Race: What Is Changing?
Two families of innovation should not be confused. The first improves thermocatalytic Haber-Bosch: the same N₂ + H₂ feed, but a more active catalyst. The second replaces it with electrochemical, plasma or light-driven routes that activate nitrogen directly. Their maturity differs by orders of magnitude (Table 1; Diagram 1).
Promoted iron remains the global workhorse. It is cheap, tolerant and long-lived, and it operates at roughly 400–500 °C and 100–300 bar. The gap between the global average energy intensity (~41 GJ/t) and best available gas-based technology (~28 GJ/t) is driven mainly by plant age, scale and feedstock, not by the catalyst (IEA, 2021). Ruthenium catalysts are more active at lower pressure. KBR's ruthenium-on-graphite KAAP catalyst was first deployed commercially in 1992 in a plant revamp in Kitimat, Canada, and allows synthesis loops of about 90 bar (Oil & Gas Journal). Ruthenium cost, support stability and sensitivity to poisons have kept it a niche technology. Electride-supported ruthenium, developed by the Hosono group in Tokyo, is marketed by Tsubame BHB for compact low-temperature, low-pressure units (Tsubame BHB). Its first small commercial facilities, sized at about 500 t/yr, confirmed ammonia production during trial operation in 2025–26 (Indian Chemical News). Cobalt, nitride, single-atom and nanostructured catalysts show promising laboratory activity under mild conditions, but their durability and scalable manufacture are unproven.
Lithium-mediated electrochemical synthesis is the most credible direct route. Laboratory Faradaic efficiencies have reached about 78% (Science, 2022), and flow cells have run for hundreds of hours. However, plating lithium requires about 3 V, which caps theoretical energy efficiency at around 28% (Nature Catalysis, 2024; ACS Energy Letters). Reported cells reach about 13%, compared with around 60% for an optimised Haber-Bosch loop (RSC Advances, 2026). Plasma-assisted synthesis reports energy costs from about 26 MJ/mol to more than 200 MJ/mol in the laboratory, against about 0.48 MJ/mol for Haber-Bosch (Energy & Fuels, 2025). A feasibility study found no investment-cost advantage over a small Haber-Bosch loop even in its best case (Catalysts, 2020). Photocatalytic routes remain at an early research stage.
Table 1. Emerging ammonia-synthesis technologies (conventional iron catalysis as benchmark). Sources: IEA (2021); Oil & Gas Journal; Tsubame BHB; Nature Catalysis (2024); Energy & Fuels (2025). Maturity reflects public evidence at the research date.
(SMR, ATR, gasification)
capture & storage
water electrolysis
or reformer air)
syngas
(3:1)
~400–500 °C, ~100–300 bar
ESTABLISHED COMMERCIAL
COMMERCIAL – NICHE / REVAMPS
EARLY COMMERCIAL – SMALL UNITS
product
LAB / BENCH
LAB
LAB (EARLY)
Diagram 1. Conventional and emerging ammonia pathways. Temperatures and pressures are typical ranges, not plant-specific values.
From Better Catalysts to Better Ammonia Economics
Catalysts influence economics through a clear chain. Ammonia formation is exothermic, so equilibrium favours lower temperatures, while breaking the N≡N bond favours higher ones. A catalyst that is active at lower temperature raises single-pass conversion. That permits lower loop pressure, which means less compression power, lighter vessels and potentially smaller reactors. Better nitrogen activation also improves kinetics and productivity per unit of catalyst. There are trade-offs: at lower pressure, ammonia is harder to condense, so separation may need absorbents or deeper refrigeration, which can offset part of the saving.
Catalyst lifetime, poisoning resistance and replacement cost affect reliability and operating cost. Electrolytic hydrogen is very pure, which helps poison-sensitive ruthenium systems.
For green ammonia, flexibility may be the most valuable catalyst attribute. A synthesis loop that can ramp with wind and solar output reduces the hydrogen buffer storage and electrolyser oversizing needed to keep a conventional loop running steadily.
Lower temperature or higher laboratory activity does not automatically mean lower total cost. In our illustrative green base case, electricity accounts for about 40% of cost and the electrolyser (capital plus O&M) for roughly 41%. The synthesis loop, air separation and storage account for only about 14%, consistent with IEA's estimate of USD 560–980 per t/yr of capacity for these units (IEA, 2025). Combining four plausible catalyst benefits (a 10–25% cheaper loop, 10–30% less loop power, smaller buffers and less curtailment) saves about USD 20–75/t (2–9%). By comparison, cutting electricity from USD 35 to 20/MWh or electrolyser cost from USD 1,400 to 800/kW each saves about USD 150/t (Chart 3). Scale also matters: a US study estimated a median cost of USD 326/t for centralised gas-based ammonia, compared with USD 659–1,634/t for decentralised grid-powered units (Renewable & Sustainable Energy Reviews, 2025). Compact catalysts help small plants but do not remove economies of scale, financing, maintenance, storage or infrastructure costs.
35→20 USD/MWh
1,400→800 USD/kW
utilisation +10 pts
(conservative)
(optimistic)
Chart 3. Data shown are sample and illustrative unless otherwise stated. Figures are presented in ranges where appropriate and should not be interpreted as a proprietary market forecast. Each lever applied alone to the green base case (USD 870/t). Catalyst cases combine lower loop capex, lower loop power, smaller buffers and less curtailment.
Green Ammonia, Grey Ammonia and Carbon Economics
Grey ammonia uses fossil hydrogen without substantial abatement. Blue ammonia adds carbon capture and storage. Green ammonia uses electrolytic hydrogen from renewable power. These labels describe feedstock, not a guaranteed emissions intensity. Lifecycle results depend on capture rates, upstream methane leakage, the electricity mix, energy use, transport and the accounting boundary (Table 2).
Table 2. Grey, blue and green ammonia: cost drivers and carbon implications. Published indicative ranges: IRENA (2022) estimates fossil ammonia at USD 110–340/t (2015–2020 gas prices) and renewable ammonia at USD 720–1,400/t (plant-gate, global, at publication), falling to USD 310–610/t by 2050. These ranges are not directly comparable with the illustrative model below.
Published evidence confirms a large but location-specific gap. IRENA's estimates are shown beneath Table 2 (IRENA, 2022). The IEA finds renewable hydrogen costs 1.5–7 times more than unabated fossil hydrogen, depending on location (IEA, 2025). India offers a real-market signal. In 2025, SECI's 13 auctions for 724 kt/yr of green ammonia discovered delivered prices of INR 49.75–64.74/kg, roughly USD 570–740/t (Energetica India). The ministry compared the first result with a grey price of about USD 515/t in March 2025 (MNRE via PTI). These are 10-year fixed contract prices supported by SIGHT incentives and aggregated offtake, however, not unsubsidised production costs, so they do not prove cost parity.
Our transparent illustrative model (plant-gate, real 2025 USD, excluding transport and subsidies) gives grey ammonia at about USD 210–560/t (gas at USD 3–12/MMBtu) and green ammonia at about USD 510–1,400/t (Chart 1). In the base case, the green premium is around USD 510/t. A carbon price of USD 100/t CO₂ adds about USD 240/t to grey ammonia. This narrows the gap, but green ammonia matches it only with low-cost electrolysers and electricity below about USD 25/MWh (Chart 2). Blue ammonia is discussed qualitatively because consistent public cost data were not available. Lower-cost low-carbon ammonia would reduce fertiliser producers' exposure to imported gas, create options for low-carbon industrial feedstocks and strengthen export competitiveness in carbon-priced markets. Its role in energy markets, however, depends on the hydrogen cost, not the catalyst.
Chart 1. Data shown are sample and illustrative unless otherwise stated. Figures are presented in ranges where appropriate and should not be interpreted as a proprietary market forecast. Plant-gate levelised cost, real 2025 USD, 8% WACC, 20 years; excludes transport, subsidies and carbon costs. Inputs and formulas are in the accompanying workbook.
Chart 2. Data shown are sample and illustrative unless otherwise stated. Figures are presented in ranges where appropriate and should not be interpreted as a proprietary market forecast. Green = (9.96 MWh/t × power price) + electrolyser and synthesis capital and O&M + other costs; base capacity factor 55%. Grey uses base gas price (USD 7/MMBtu); carbon cost = 2.4 t CO₂/t × USD 100/t.
Growing Ammonia Use and the Rise of Bunkering Hubs
Marine fuel is the most visible new demand pathway, but it is at the trial stage.
In 2024, Fortescue's Green Pioneer loaded ammonia in Singapore and received flag approval to use it with diesel (Energy Connects). In September 2026, a converted 5,500 m³ gas carrier became the first certified ship-to-ship ammonia bunker vessel (Manifold Times). The same month, NYK completed the first ship-to-ship transfer to an ammonia-fuelled gas carrier, due for delivery in November 2026 (Shipping Herald).
Singapore's MPA authorised ITOCHU's ship-to-ship bunkering trials from May 2026 for up to two years, with a dedicated bunker vessel due in 2027 (Maritime Executive).
Green corridors and bunkering plans at other ports remain proposals.
The IMO has issued interim guidelines for ammonia-fuelled ships and seafarer training (Safety4Sea). Adoption at scale depends on toxicity management, control of NOx, nitrous oxide and ammonia slip, engine maturity, lifecycle emissions, fuel availability and price. Grey ammonia offers no well-to-wake climate benefit.
(~70% of use)
industry
carrier
(emerging)
Infographic 2. Qualitative schematic. The ~70% fertiliser share is from IEA (2021); other applications are not to scale.
Diagram 2. Simplified, conceptual ecosystem. It does not depict any specific port or confirm operational commercial hubs.
Regulations and Market Drivers
EU CBAM
Adopted, applicableThe definitive regime began on 1 January 2026 and covers fertilisers, including ammonia, and hydrogen (European Commission). Certificate sales open on 1 February 2027, and the first declaration and surrender, covering 2026 imports, is due on 30 September 2027 (Sovran briefing). Embedded emissions become a priced cost for EU-bound supply, and verified plant data become commercially valuable.
EU renewable-hydrogen rules
AdoptedDelegated Regulation (EU) 2023/1184 requires additionality and geographic correlation, plus monthly time-matching until 2029 and hourly matching from 2030. This affects electrolyser utilisation and cost; the rules remain under industry pressure for revision (Stibbe).
India
In forceNational Green Hydrogen Mission SIGHT incentives underpin the SECI green ammonia procurement.
IMO
Not yet adoptedThe Net-Zero Framework was approved in April 2025, but its adoption was adjourned in October 2025 (DNV). A resumed session is scheduled for 4 December 2026 (Ammonia Energy Association). Until it is adopted, there is no global fuel-intensity obligation or pricing mechanism for shipping, only a signal for investment.
Timeline. Status verified at 29 September 2026 from the sources cited in Sections 04, 05 and 07. Scheduled dates and project targets may change.
Commercialisation Barriers and Reality Check
Productivity that is often orders of magnitude below industrial space-time yields; durability, with deactivation, poisoning and sintering rarely tested beyond thousands of hours; materials, particularly ruthenium cost and supply; separation and purity at low pressure; and scale-up of reactors and electrochemical stacks.
Intermittent power and the plant utilisation it allows, capital cost and financing, safety, certification and infrastructure, and uncertain demand and willingness to pay a green premium.
Improved catalysts are one contributor to lower-carbon ammonia economics, not a standalone solution.
Future Outlook
Near term
Gains will come from optimising established Haber-Bosch plants, incremental catalyst improvements and efficiency upgrades, and integrating renewable hydrogen into iron-catalyst loops. The first large projects, such as NEOM (1.2 Mt/yr, in commissioning with commercial output targeted for 2027), will provide the first real operating-cost data (Hydronews).
Medium term
Expect wider demonstration of ruthenium and electride catalysts in flexible, lower-pressure loops, electrified and intensified processes, and load-following plants, where they prove commercially viable.
Longer term
Modular or decentralised production and direct electrochemical routes could follow, but only if productivity, energy efficiency, durability, cost, safety and infrastructure all improve substantially.
Watch demonstrated catalyst lifetime; productivity per unit of catalyst; energy use per tonne; audited plant-gate costs; lifecycle emissions; project commissioning; signed and delivered offtake; and operational bunkering infrastructure, as distinct from trials.
Catalyst innovation can change ammonia economics at the margin, typically by single-digit percentages, and more significantly by enabling flexible and smaller plants. The commercial outcome will depend on the combined economics of catalysts, hydrogen, electricity, plant design, carbon intensity and market demand.
IEA (2021). Ammonia Technology Roadmap.
IRENA & AEA (2022). Innovation Outlook: Renewable Ammonia.
IEA (2025). Global Hydrogen Review 2025.
IEA (2025). Global Hydrogen Review Assumptions Annex.
Nature Catalysis (2024). Li-mediated NRR review.
Science (2022). Li-mediated synthesis with O₂.
ACS Energy Letters. Energy-efficiency challenge.
RSC Advances (2026). Li-NRR review.
Energy & Fuels (2025). Plasma-catalysis review.
Catalysts (2020). Plasma feasibility.
Oil & Gas Journal. KAAP catalyst.
Tsubame BHB. Technology.
Tsubame BHB. Commercial trial.
Renewable & Sustainable Energy Reviews (2025). Centralised vs decentralised NH₃.
MNRE / SECI. First auction (PTI).
Energetica India. SECI auction series.
European Commission. CBAM.
CBAM 2026–27 timeline.
Stibbe. EU RFNBO rules.
DNV. IMO NZF adjournment.
Ammonia Energy Association. MEPC 84 outcome.
IMO. Interim ammonia guidelines.
Fortescue Green Pioneer, Singapore.
First ammonia bunker vessel.
NYK ship-to-ship bunkering.
Singapore MPA trial authorisation.
NEOM commissioning.
All sources accessed 29 September 2026; proprietary price databases not used. Illustrative model: Catalyst_Innovation_Ammonia_Data_and_Assumptions.xlsx.
From catalyst breakthroughs to commercial advantage
Turning catalyst breakthroughs into commercial advantage requires more than understanding reaction chemistry. Producers, investors and buyers need to assess the combined effects of hydrogen and electricity costs, production technology, carbon intensity, regulation, infrastructure and market demand. EnviroSusIQ's decarbonisation analytics connects these factors through:
Low-carbon technology assessment
Carbon-adjusted commodity economics
Green hydrogen and ammonia market intelligence
Production-cost and sensitivity modelling
Carbon-intensity benchmarking and regulatory tracking
Project-pipeline and supply–demand analysis
Price and scenario modelling, delivered-cost and export-competitiveness analysis
Explore EnviroSusIQ's decarbonisation and commodity intelligence capabilities at www.envirosusiq.com.
Assessing the economics of low-carbon ammonia?
ESIQ helps producers, investors and buyers connect catalyst and process innovation to hydrogen costs, carbon intensity and market competitiveness.
Continue the research
The Future of Urea Manufacturing
How ageing plants, technology upgradation, Industry 5.0 and cost pressures are shaping the future of low-carbon urea manufacturing.
Read More →
From Ambition to Market Reality: Where Could India's Green Hydrogen Opportunity Emerge?
A scenario-based view of India's green hydrogen opportunity across demand, supply, sector adoption and the emerging market gap.
Read More →
Marine Shipping Decarbonisation
Navigating the transition to low-carbon shipping - the regulations, fuels, infrastructure and freight economics reshaping global trade.
Read More →