
Reshaping Global Fertilizer Trade Under Carbon Border Adjustments
How CBAM's definitive regime is reordering nitrogen competitiveness - and why nutrient-adjusted economics now matter more than product price.
CBAM's definitive regime began on 1 January 2026, and with it the embedded-emissions obligation that will progressively reprice one of the most carbon-intensive links in the global food chain. For fertilizer buyers and producers, the change is not simply a new line of cost. It shifts the basis of competitiveness away from a straightforward FOB price comparison toward a composite of feedstock cost, verified carbon intensity, freight, conventional trade measures and nutrient density.
This briefing sets out what the definitive regime changes, which fertilizer products are actually covered, why nutrient-adjusted comparison is the only defensible metric for nitrogen, and how carbon policy should be separated from sanctions and conventional tariffs when assessing origin competitiveness. It draws on public sources only, and uses ranges and labelled assumptions throughout - it is not a proprietary market assessment or supplier quotation.
CBAM's definitive regime began on 1 January 2026. Liability accrues from that date, but certificates can only be bought from 1 February 2027, with the first declaration due 30 September 2027.
The certificate price tracks EU ETS auctions (2026 Q1: €75.36/tCO₂e; Q2: €75.28/tCO₂e). The free-allocation adjustment reduces the effective requirement - the 2026 phase-in is 2.5 percentage points, not a universal 2.5% of gross emissions.
Ammonia, urea, nitric acid, AN/CAN, UAN and ammonium sulphate are directly covered. DAP, MAP and N-bearing NPK need shipment-specific CN verification; straight phosphate and potash are outside current scope - a regulatory boundary, not an absence of carbon footprint.
For nitrogen, $/t N is the meaningful comparison, not product price. Urea's higher concentration can support a delivered advantage under illustrative assumptions, but limited public ammonium-sulphate data make this a methodology demonstration, not a market ranking.
2026 price volatility reflected shipping-route disruption, energy and feedstock costs, regional supply, trade restrictions and seasonal demand in varying measure by product and region. Public reference data are indicative observations, not universal transaction prices.
Russia/Belarus competitiveness reflects sanctions, additional EU tariffs and CBAM - distinct policy layers to assess separately, not attribute to carbon policy alone.
CBAM's near-term cash-cost impact is reduced by the current free-allocation adjustment, but the actual amount is shipment-specific; freight, feedstock and product-market conditions can also be material. Avoid comparing a generic CBAM percentage with a product price without applying the relevant benchmark and emissions basis.
The scheduled step-up in net CBAM liability is not immediate; current law phases it in progressively, giving buyers and suppliers a multi-year adjustment window, subject to any future regulatory amendment.
Product-price comparisons are unreliable for nitrogen fertilizers; nutrient-adjusted comparisons can change the competitive picture, though data limitations (particularly for ammonium sulphate) constrain precision.
Coverage is uneven across the fertilizer basket: nitrogen products carry the clearest direct exposure, DAP/MAP require case-by-case verification, and phosphate/potash carry none under current rules.
Liability begins now; cash flows later
The EU Carbon Border Adjustment Mechanism (Regulation (EU) 2023/956) entered its definitive regime on 1 January 2026, replacing the 2023-2025 reporting-only transitional phase. From that date, embedded-emissions liability begins accruing on covered imports, but the compliance and cash-flow timeline runs in arrears: certificate sales open only on 1 February 2027 (postponed from the original 2026 start date by the October 2025 "Omnibus" simplification, Regulation (EU) 2025/2083), and the first annual declaration - covering all of calendar-year 2026 - is due 30 September 2027, when declarants must hold certificates equal to at least 50% of cumulative embedded emissions.
Six elements determine the actual obligation
Six elements determine an importer's actual CBAM cash obligation: (a) embedded emissions, based on verified actual values or applicable Commission default values; (b) the free-allocation adjustment, which reduces the number of certificates to surrender; (c) the applicable product benchmark and methodology; (d) the CBAM certificate price; (e) any eligible carbon price already paid in the country of origin; and (f) the timing of purchase and surrender. These elements should not be collapsed into a single generic percentage. Commission default values were corrected in July 2026, with the updated values published in August 2026; fertilizers have a specific lower default-value mark-up than most other covered sectors.
The commonly cited 2.5% figure describes the 2026 phase-in of CBAM relative to the free-allocation adjustment schedule. It is not a stand-alone universal percentage of every shipment's gross emissions liability. The actual certificate requirement depends on the relevant benchmark, embedded-emissions basis and whether actual or default values are used. Any proposal to alter the phase-down schedule should be treated separately from current law.
Table 1. CBAM timeline and key regulatory changes. Values are based on official EU regulatory sources where indicated. Where a proposal is referenced, it is explicitly identified as not yet adopted. Sources: Regulation (EU) 2023/956; Regulation (EU) 2025/2083; European Commission CBAM certificate price publications.
Coverage follows the CN code, not the trade name
CBAM's fertilizer scope centers on specified goods under Annex I and their CN codes. Directly covered nitrogen products include ammonia, nitric acid and specified fertilizers such as urea, ammonium nitrate/CAN, UAN and ammonium sulphate. For compound fertilizers such as DAP, MAP and nitrogen-bearing NPK products, treatment should be determined from the exact CN classification and applicable emissions methodology rather than assumed from the product's trade name. Straight phosphate and potash products that are outside Annex I are not currently covered.
Table 2. Fertilizer CBAM coverage. Classification is based on official CN coding under Regulation (EU) 2023/956 Annex I and publicly available Commission sector guidance. Exact treatment should be verified against the current implementing regulation for any specific shipment.
Route labels are not a substitute for verified data
Nitrogen-fertilizer emissions are strongly influenced by the hydrogen and ammonia production route. Gas-based steam methane reforming is generally lower-carbon than coal-based gasification, while blue and green ammonia can reduce emissions further depending on capture performance, electricity source and system boundaries. However, plant-level emissions vary materially, so route labels should not be used as a substitute for verified installation-level data. Ammonium sulphate emissions also vary significantly by production route, particularly between dedicated production and co-product routes; public plant-level data are limited.
Carbon intensity alone does not determine competitiveness; landed cost also reflects feedstock price, plant efficiency, freight, conventional duty and, where applicable, sanctions or additional trade measures. Phosphate and potash sit on a different curve: phosphate rock beneficiation and phosphoric-acid manufacture are energy-intensive but outside CBAM's covered-sector list, with competitiveness set mainly by ore grade, sulphur cost and export policy; potash is mined with comparatively low process emissions and no CBAM linkage under current rules.
Compare within a nutrient family, never across
Nitrogen, phosphate and potash are economically distinct nutrients with different demand curves; summing N + P₂O₅ + K₂O (and sometimes S) into one "active nutrient" tonnage overstates the competitiveness of dilute products and understates nitrogen-dense ones. The defensible comparison sits within a nutrient family - $/t N for nitrogen products, $/t P₂O₅ for phosphates, $/t K₂O for potash - with sulphur valued as a separate agronomic credit, never folded into the nitrogen denominator.
Urea vs ammonium sulphate: 2.2× the tonnage
Urea is typically specified at approximately 46% nitrogen; standard-grade ammonium sulphate is typically approximately 21% nitrogen and approximately 24% sulphur, although specifications vary by producer. On these standard specifications, delivering one tonne of nitrogen requires approximately 2.17 tonnes of urea versus approximately 4.76 tonnes of ammonium sulphate - roughly 2.2 times the product volume. This illustrates why freight and handling can materially affect a $/t N comparison. It does not, by itself, establish which product has the lower delivered cost, because transparent public ammonium-sulphate price data are limited.
Exhibit 1. Product tonnage required to deliver one tonne of nitrogen, on standard grade specifications. Author calculation; specifications vary by producer.
Table 3. Urea vs ammonium sulphate: nutrient-adjusted comparison (sample / illustrative). All commercial comparison cells are sample / illustrative and are not quoted market prices, supplier quotations or proprietary market data. Product specifications are typical reference values and may vary by producer. Where a robust public benchmark was not identified, the table deliberately avoids a false point estimate.
The illustrative calculation demonstrates the methodology rather than establishing a definitive ranking. Urea's higher nitrogen concentration reduces the product tonnage required per tonne of nitrogen, but the final delivered $/t N comparison depends on product price, freight, emissions, CBAM methodology and the economic value assigned to sulphur. Public data limitations for ammonium sulphate materially constrain precision.
A structural view, not a cost curve
Landed cost reflects factors that move independently and are not reducible to a single ranking: feedstock cost, plant efficiency, product grade, emissions intensity, freight, conventional EU tariffs, sanctions, trade agreements, export restrictions and supplier-specific circumstances. Public sources do not support a precise cross-country cost ranking at individual-plant level; the table is therefore a structural, qualitative assessment rather than a cost curve or supplier ranking.
Table 4. Structural export competitiveness (sample / illustrative). This is a qualitative framework based on public information. It is not a cost curve, price assessment or supplier ranking; actual competitiveness can differ materially by plant, contract, route and product grade.
Outside CBAM, but not outside policy risk
DAP and MAP, where potentially covered based on the exact CN classification, should be assessed using the applicable CBAM methodology for the relevant shipment. Their economics are also influenced by phosphate rock, sulphur/sulphuric-acid availability, freight and regional supply-demand conditions. Public reference prices can be useful indicators, but they are not universal transaction prices and should not be presented as precise global benchmarks without a consistent basis.
TSP and SSP are outside the current CBAM covered-sector list, as are the specified potash products outside Annex I. Their economics are therefore driven primarily by mining/feedstock conditions, processing costs, freight and trade policy. Russian and Belarusian potash supply is additionally affected by sanctions and trade measures. Public price references should be treated as indicative observations rather than universal transaction prices.
MOP and SOP likewise carry no CBAM exposure under current rules; potash economics are reported as governed by mining cost and reserve geography, with Russian/Belarusian supply specifically affected by sanctions and trade measures rather than carbon policy. World Bank commodity reporting has also shown TSP and MOP reference prices at higher levels across 2026 forecasts than in 2024.
These positions are sample / illustrative directional observations, not fixed structural facts or forecasts. They should be re-tested as carbon prices, freight, trade measures and product-specific emissions data evolve.
Who is better positioned, and who is under pressure
Nitrogen producers with EU trade access and shorter freight routes, subject to plant-specific verification
Ammonium sulphate in sulphur-deficient markets, where data support the agronomic case
Producers able to supply verified, installation-level emissions data
Potash and straight-phosphate producers (no direct CBAM exposure under current rules)
Producers reliant on default emissions values as the CBAM adjustment factor rises
Nitrogen exporters facing sanctions or additional trade tariffs, independent of CBAM
Buyers unable to verify supplier emissions as scheduled adjustments phase in
Origins facing compounding carbon, tariff and shipping-disruption risk simultaneously
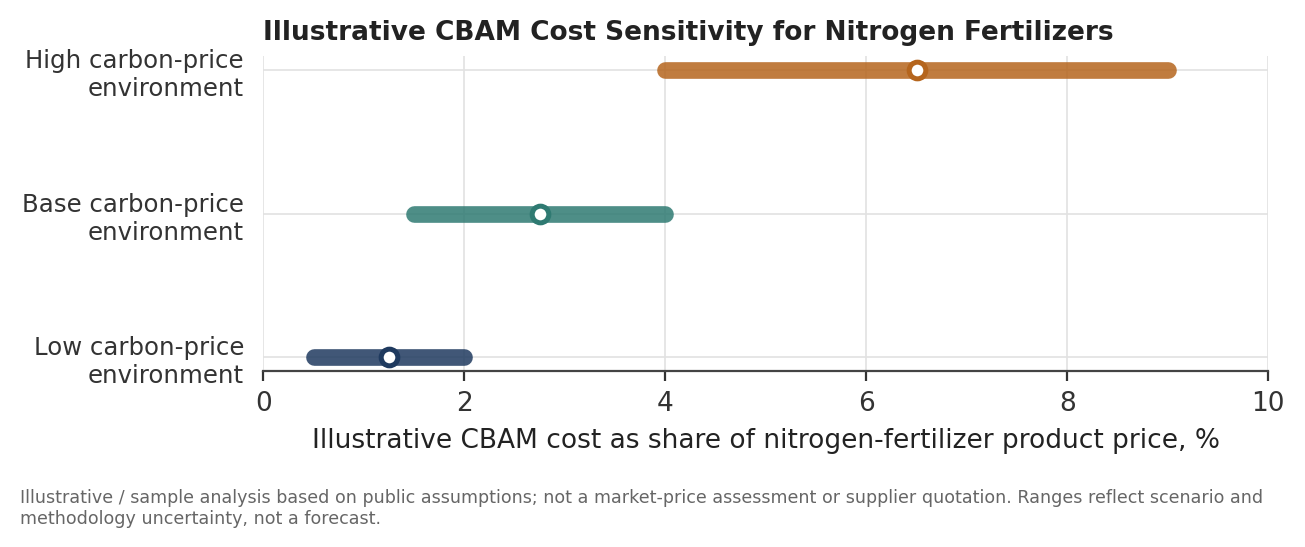
Exhibit 2. Illustrative CBAM cost sensitivity for nitrogen fertilizers. Illustrative / sample analysis based on public assumptions; not a market-price assessment or supplier quotation. Ranges reflect scenario and methodology uncertainty, not a forecast.
Table 5. Scenario analysis. Illustrative scenario used to test sensitivity rather than to forecast outcomes. Not a supplier quotation or proprietary market assessment.
Seven practical actions for buyers
2026 fertilizer-market volatility reflected multiple overlapping factors - including shipping-route disruption, energy and feedstock costs, regional supply and trade restrictions - whose relative contribution differs by product and region. Public reference data should therefore be treated as indicative observations rather than universal transaction prices. The analysis supports monitoring carbon, commercial and geopolitical variables separately while recognising that they interact in landed-cost decisions.
Request supplier-verified emissions data rather than relying on Commission default values, while recognising that the default-value framework and corrected values are regulatory inputs that can change.
Compare nitrogen suppliers on an illustrative $/t N basis (or $/t P₂O₅, $/t K₂O), while recognising data limitations - particularly for ammonium sulphate.
Separate CBAM exposure from conventional tariff exposure and sanctions-related trade measures; treat them as distinct legal and commercial layers with different legal bases and timing.
Incorporate freight explicitly and verify whether quoted prices are FOB, CFR, CIF or delivered before comparing them.
Value sulphur content separately when assessing ammonium sulphate or SOP; do not treat it as a nitrogen or potash substitute.
Where feasible, diversify origins given the compounding effect of carbon, trade-policy and shipping-disruption risk.
Monitor EU ETS and CBAM methodology directly, including default values and the free-allocation schedule, both of which have already been revised in 2026 and may change again - including the pending, not-yet-adopted proposal to slow the phase-down schedule.
This briefing classifies material quantitative statements into official regulatory data, public market data, public company disclosure, author calculation or illustrative assumption. Author calculations and illustrative assumptions are explicitly labelled and should not be read as observed market prices or supplier quotations. Where reliable public benchmark data were not identified, the briefing uses qualitative positioning or clearly labelled illustrative ranges rather than inventing precision. No proprietary or subscription commodity database is used or cited. Regulatory statements distinguish current law from proposed, not-yet-adopted changes.
From FOB price to composite competitiveness
CBAM shifts fertilizer competitiveness from a simple FOB-price comparison toward a combination of FOB cost, embedded carbon, CBAM liability, freight, conventional trade measures and nutrient density. Under current law, the commercially material step-up in net liability is not immediate: the earlier years of the definitive regime operate under a comparatively low adjustment factor, with a more significant increase scheduled later in the decade - a timeline the Commission has proposed, but not yet adopted, changes to.
For nitrogen specifically, the available evidence supports a cautious conclusion: urea can retain a delivered $/t N advantage under illustrative assumptions because of its higher nitrogen concentration, but the comparison is sensitive to price, freight, carbon-intensity and sulphur-value assumptions, and transparent public data for ammonium sulphate remain limited. This briefing demonstrates a defensible methodology for making that comparison rather than establishing a definitive market ranking. For phosphate and potash, CBAM does not appear to be a material competitive factor under current rules; mining economics, sulphur cost, freight and trade policy dominate. Russia and Belarus illustrate the importance of separating policy layers: their EU competitiveness reflects sanctions and additional tariff measures more than CBAM specifically.
2026 fertilizer-market volatility reflected multiple overlapping factors - shipping-route disruption, energy and feedstock costs, regional supply and trade restrictions among them - whose relative contribution differs by product and region and cannot be precisely apportioned from public data. Producers and buyers with a multi-year window before CBAM's scheduled cost step-up becomes material would be well served by building verified-emissions capability now, comparing suppliers on a nutrient-adjusted basis where data allow, and treating carbon, commercial and geopolitical risk as distinct but simultaneously monitored variables.
The multi-year window before CBAM's scheduled step-up is the window to build verified-emissions capability - not to wait for the cost to arrive.
This briefing classifies every material quantitative statement into one of five categories: official regulatory data; public market data; public company disclosure; author calculation; or illustrative assumption. Author calculations and illustrative assumptions are explicitly labelled throughout and should not be read as observed market prices or supplier quotations. Where reliable public benchmark data were not identified - notably for ammonium sulphate pricing and for product-level CBAM cost estimates beyond the single published urea figure cited - the briefing uses qualitative positioning or clearly labelled illustrative ranges rather than inventing precision. No proprietary or subscription commodity database has been used or cited. Prices are not mixed across FOB, CFR, CIF and delivered bases without stating the basis. Regulatory statements distinguish current law from proposed, not-yet-adopted changes throughout. Actual costs vary materially by producer, production route, verification status, contract terms and geography; nothing in this document should be read as a market-price quotation, a forecast, or investment, trading or legal advice.
European Commission. (2023). Regulation (EU) 2023/956 establishing a Carbon Border Adjustment Mechanism, as amended by Regulation (EU) 2025/2083. Brussels: Official Journal of the European Union.
European Commission. (2025). Commission Implementing Regulation (EU) 2025/2620 on the free-allocation adjustment and related CBAM guidance. Brussels: Official Journal of the European Union.
European Commission. (2026). CBAM certificate price publications, Q1–Q2 2026. Brussels: European Commission.
European Commission. (2026). Commission Implementing Regulation (EU) 2025/2621, as corrected by Regulation (EU) 2026/1740 – definitive-period default values. Brussels: Official Journal of the European Union.
European Commission. (2026). Definitive-period fertiliser guidance. Brussels: European Commission, DG TAXUD.
Eurostat and DG AGRI. Public trade data; European Parliament public reporting on CBAM implementation. Luxembourg / Brussels: European Union.
Various producers. Public company disclosures and sustainability reports, used only where relevant to production-route context.
World Bank. (2026). Commodity Markets Outlook and Commodity Price Data. Washington, DC: World Bank Group.
Research built for carbon border decisions
ESIQ supports stakeholders in navigating carbon border policies with tailored intelligence on trade flows, nutrient economics, and decarbonization strategies. Our expertise helps agribusinesses and policymakers adapt to shifting competitiveness under CBAM and beyond.
CBAM Exposure & Compliance Mapping
Shipment-level coverage assessment against Annex I and CN codes, benchmark selection and free-allocation adjustment modelling.
Nutrient-Adjusted Cost Analysis
Delivered $/t N, $/t P₂O₅ and $/t K₂O comparison frameworks with freight, carbon and sulphur-credit sensitivities.
Trade Flow & Origin Intelligence
Mapping how carbon policy, conventional tariffs and sanctions layer differently across supplying origins and routes.
Emissions Verification Readiness
Supporting buyers and producers in moving from Commission default values to verified installation-level emissions data.
Policy & Regulatory Monitoring
Tracking default values, benchmarks, the free-allocation schedule and pending amendments as they move from proposal to law.
Procurement & Sourcing Strategy
Origin diversification, contract-basis discipline and scenario testing across carbon, freight and trade-policy variables.
Navigating fertilizer trade under carbon borders?
ESIQ partners with agribusinesses, traders and policymakers to turn carbon border policy into decision-grade procurement and market strategy.
Continue the research
Carbon-Aware Pricing: The Next Frontier in Commodity Intelligence
How carbon intensity, production economics and regulation are reshaping commodity price discovery, procurement and trade.
Read More →
Climate Finance: Powering the Global Energy Transition
Navigating the trillion-dollar shift - accelerating capital realignment for the climate transition, the instruments mobilising it, and the gaps still standing in its way.
Read More →
Marine Shipping Decarbonisation
Navigating the transition to low-carbon shipping - the regulations, fuels, infrastructure and freight economics reshaping global trade.
Read More →