
When Power Prices Go Negative
How AI can turn oversupply into opportunity.
Authored by Parvez Momin

Negative electricity prices are not simply a pricing anomaly. They are a signal that electricity supply, demand and system flexibility are temporarily out of balance. AI can help market participants anticipate these conditions, optimize flexible resources and convert periods of oversupply from a pure risk into a potential source of value.
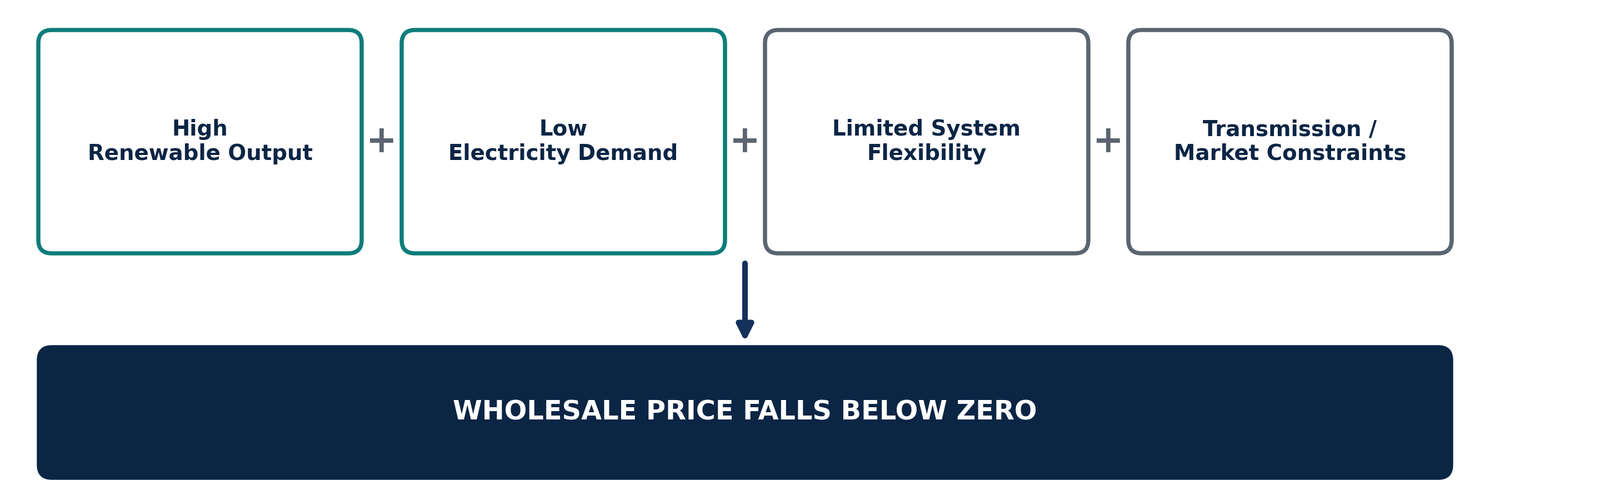
Figure 1. Why power prices go negative — the conditions that must coincide.
Five takeaways for market participants
A negative price is a market-clearing outcome, not a billing error — and a wholesale phenomenon that rarely reaches the household bill.
Renewables do not cause negative prices. Rising penetration raises the probability of an event under specific system conditions — demand level, fleet flexibility, storage depth and network capacity decide the outcome.
The challenge is timing, not volume: net load falls steeply at midday and ramps sharply into the evening. Both ends of the duck curve are flexibility problems.
A point price forecast is insufficient. The decision-relevant outputs are probability, expected duration and expected depth of the negative-price block.
Value requires flexibility. Analytics without a flexible resource to direct produces insight but not outcome — and storage build-out will arbitrage part of the opportunity away.
A market-clearing outcome, not a billing error
A negative electricity price occurs when the wholesale market-clearing price falls below zero. In that settlement interval, participants injecting electricity into the market do not receive payment for energy; they may effectively pay to deliver it, while consuming parties are paid to take it. The mechanism is a market-clearing outcome, not a billing error.
This is a wholesale phenomenon and should not be confused with retail electricity bills. Most retail tariffs are fixed or lagged, so a negative wholesale hour rarely reaches the household bill — though dynamic and time-of-use tariffs increasingly pass some of this signal through.
Events are not uniform: they vary by market, by location within a market, by settlement interval (hourly, half-hourly or five-minute), by duration, by applicable price floor and by market design. Cross-jurisdiction comparisons must therefore be made with care. This article focuses on wholesale power markets.
Three structural reasons explain the behaviour:
Technical inflexibility — some thermal and nuclear units face significant cost, time or wear penalties when cycling off and back on. Accepting a short negative price can be cheaper than shutting down.
Out-of-market revenue — where a generator earns subsidies, certificates or contractual payments tied to output volume, continuing to generate can remain net-positive even at a negative energy price.
Physical balance — electricity supply and demand must match instantaneously. When surplus cannot be stored, exported or curtailed quickly enough, price must fall far enough to induce someone to absorb it.
Five conditions must coincide
Negative prices are rarely caused by a single factor. They emerge from an interaction: abundant low-marginal-cost generation arrives at a moment when demand is weak, the system cannot move the surplus elsewhere, and too little of the fleet can respond quickly.
NEGATIVE-PRICE RISK ≈ High Generation + Low Demand + Limited Flexibility + Transmission Constraints + Market Conditions
Table 1. Conditions that increase negative-price risk.
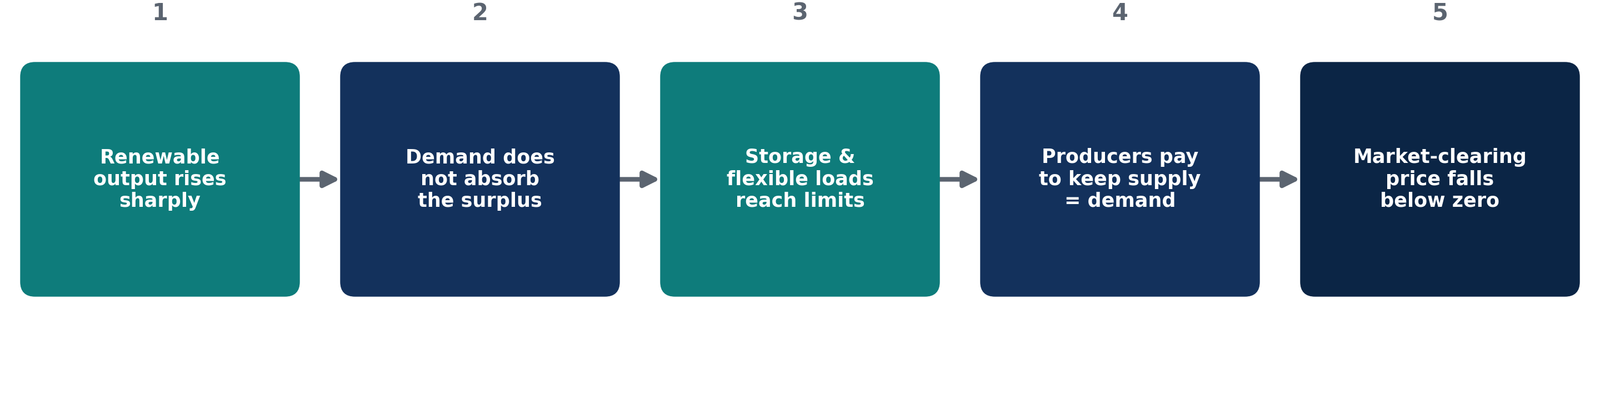
Figure 2. How renewable oversupply becomes a negative-price event.
Renewables don’t cause negative prices — net load does
It is analytically incorrect to say renewables cause negative prices. Solar and wind have near-zero marginal cost, so they clear first in merit order and depress prices during high-output hours. Whether that depression crosses zero depends on everything else: demand level, how much of the conventional fleet can reduce output, available storage, and whether the network can move the energy to where it is needed.
Rising solar and wind penetration therefore increases the probability of negative-price events under specific system conditions, rather than producing them independently — the same capacity in a system with deep storage, strong interconnection and flexible demand yields very different outcomes.
The practical framing is net load — demand minus variable renewable output. Where solar penetration is high, net load falls steeply at midday and rises sharply into the evening: the duck curve. The daytime trough is where oversupply, curtailment and negative prices concentrate; the evening ramp is where flexibility is stressed. Both are timing problems, not volume problems.
“The challenge is increasingly not simply how much electricity is produced, but when electricity is produced relative to when it is needed.”
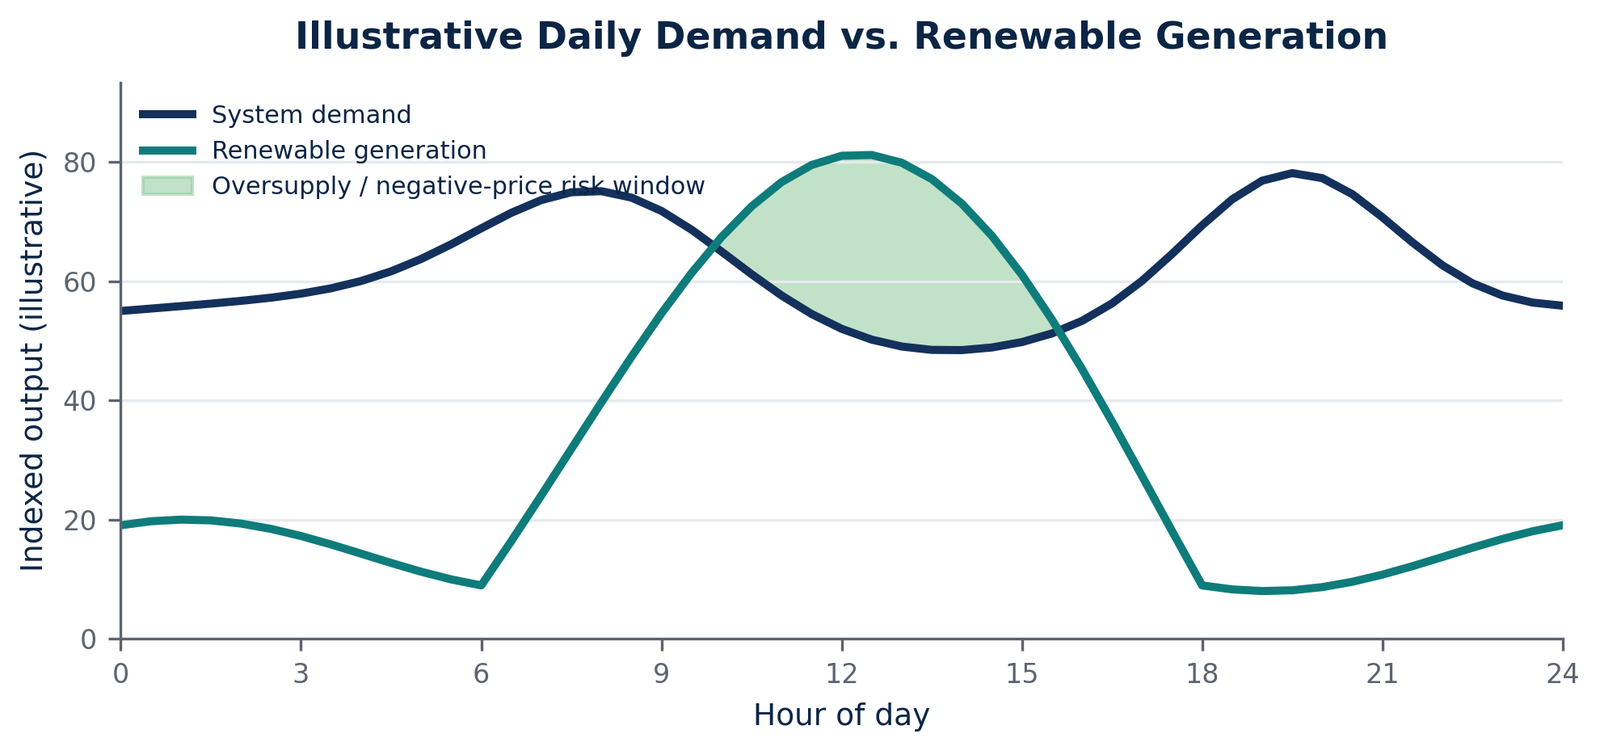
Figure 3. Illustrative daily demand vs. renewable generation. Note: data is sample and illustrative, intended to demonstrate the analytical concept and does not represent actual market observations.
Weather moves both sides of the balance at once
Weather is unusual among market drivers because it moves both sides of the balance at once. On the demand side, temperature drives heating and cooling load, with humidity shaping cooling demand in warm markets. On the supply side, wind speed, irradiation, cloud cover, rainfall and hydrology determine how much zero-marginal-cost energy arrives.
Risk concentrates where these effects push in the same direction: mild temperatures suppress heating and cooling demand at precisely the moment clear skies or strong wind lift renewable output. Because the correlation is physical rather than statistical, it persists and affects neighbouring markets simultaneously — which is why interconnection provides less relief than nameplate capacity suggests.
Combinations that raise risk
Strong wind coinciding with overnight or weekend demand troughs.
High solar output during mild spring or autumn conditions, when neither heating nor cooling load is material.
High hydro availability following heavy rainfall or snowmelt, alongside low seasonal demand.
Public holidays and extended weekends with strong renewable output and reduced industrial load.
Patterns operate on three timescales: daily (midday solar troughs, overnight wind), weekly (weekend and holiday demand reductions) and seasonal (shoulder-season mildness with strong renewable resource). These are structured, recurring signals — which is what makes them tractable for machine-learning models.
A global pattern, with local causes
Negative pricing is now documented across several mature and rapidly decarbonising markets. The causes differ meaningfully between them, and the differences matter more than the headline counts.
Table 2. Representative markets and underlying drivers.
Sources: publicly available data and reporting from national system operators, market operators, energy regulators and government statistical agencies. The mechanisms above are not identical across markets and should not be generalised.
A spring weekend oversupply event
The following is a clearly labelled illustrative scenario constructed to demonstrate the analytical mechanics. It is not a reconstruction of a specific historical event and contains no fabricated market observations.
Note: Data is sample and illustrative, intended to demonstrate the analytical concept and does not represent actual market observations.
Negative prices redistribute value
Negative prices redistribute value. The same hour that erodes merchant generation revenue creates an arbitrage opportunity for storage and a procurement advantage for flexible consumers. Position, not sentiment, determines the outcome.
Table 3. Stakeholder impact matrix and potential AI responses.
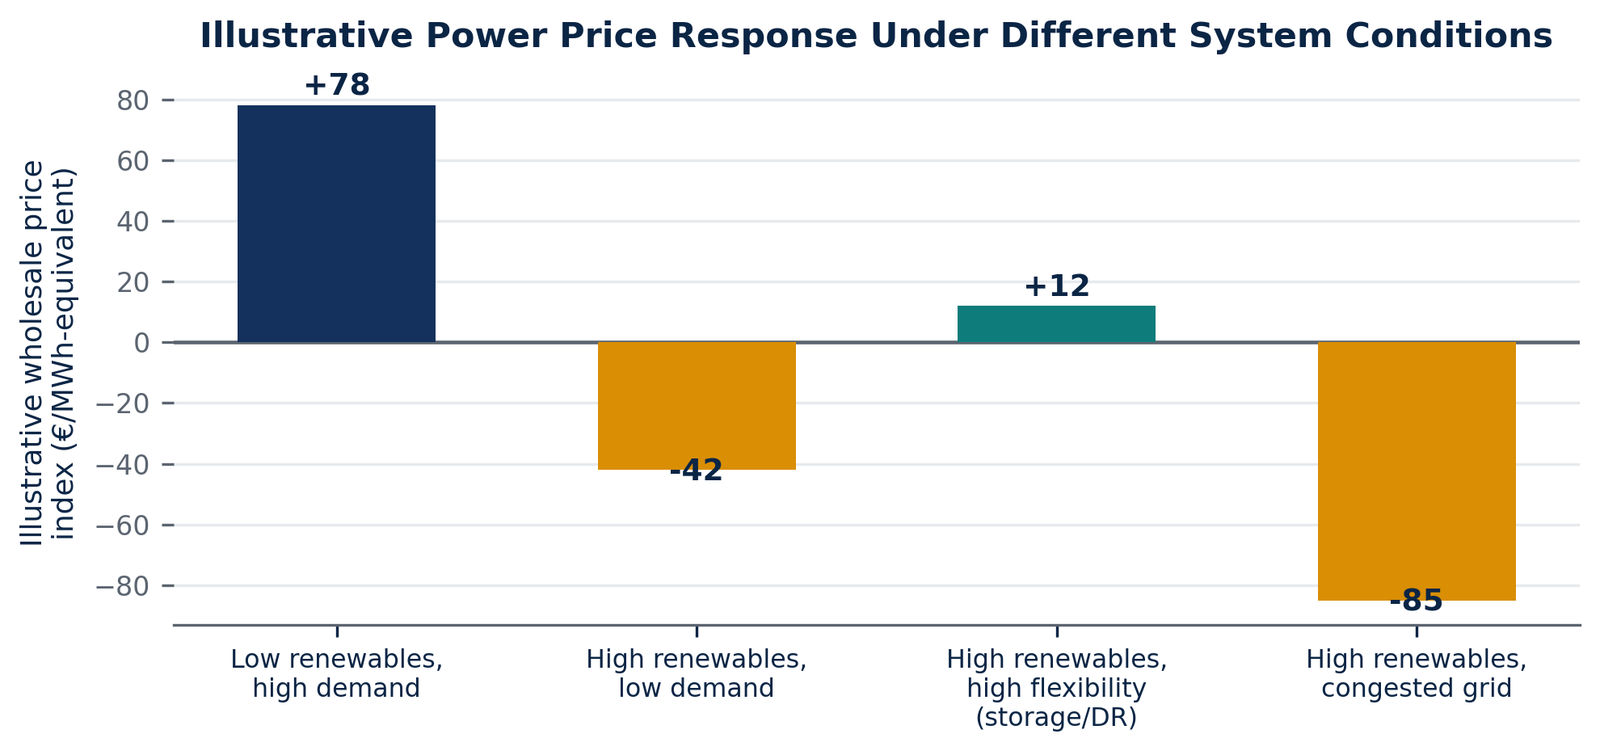
Figure 4. Illustrative power price response under different system conditions. Note: data is sample and illustrative, intended to demonstrate the analytical concept and does not represent actual market observations.
From a single forecast to a full risk profile
Conventional forecasting asks one question: what will the price be? That is insufficient here. A point forecast landing near zero says almost nothing about the decision that matters — whether to charge, shift, curtail or hedge. Negative-price events are better treated as a probabilistic, structured risk with several distinct dimensions.
Decision-relevant model outputs
Power-price forecast across relevant horizons and settlement intervals.
Probability that price falls below zero in a given interval.
Expected duration of the negative-price block — a two-hour dip and a nine-hour block imply very different storage strategies.
Expected depth of the negative price, which determines whether paid absorption is economic.
Renewable oversupply probability and associated curtailment risk.
System flexibility requirement, and the resulting BESS charging and demand-response opportunity.
Methodologically, these problems suit ensemble and gradient-boosted tree methods, neural sequence models for temporal structure, and quantile approaches producing full predictive distributions rather than point values. Published academic work consistently finds machine-learning methods outperform classical linear time-series models on short-term price forecasting in high-renewable markets — while noting that performance degrades during structural change.
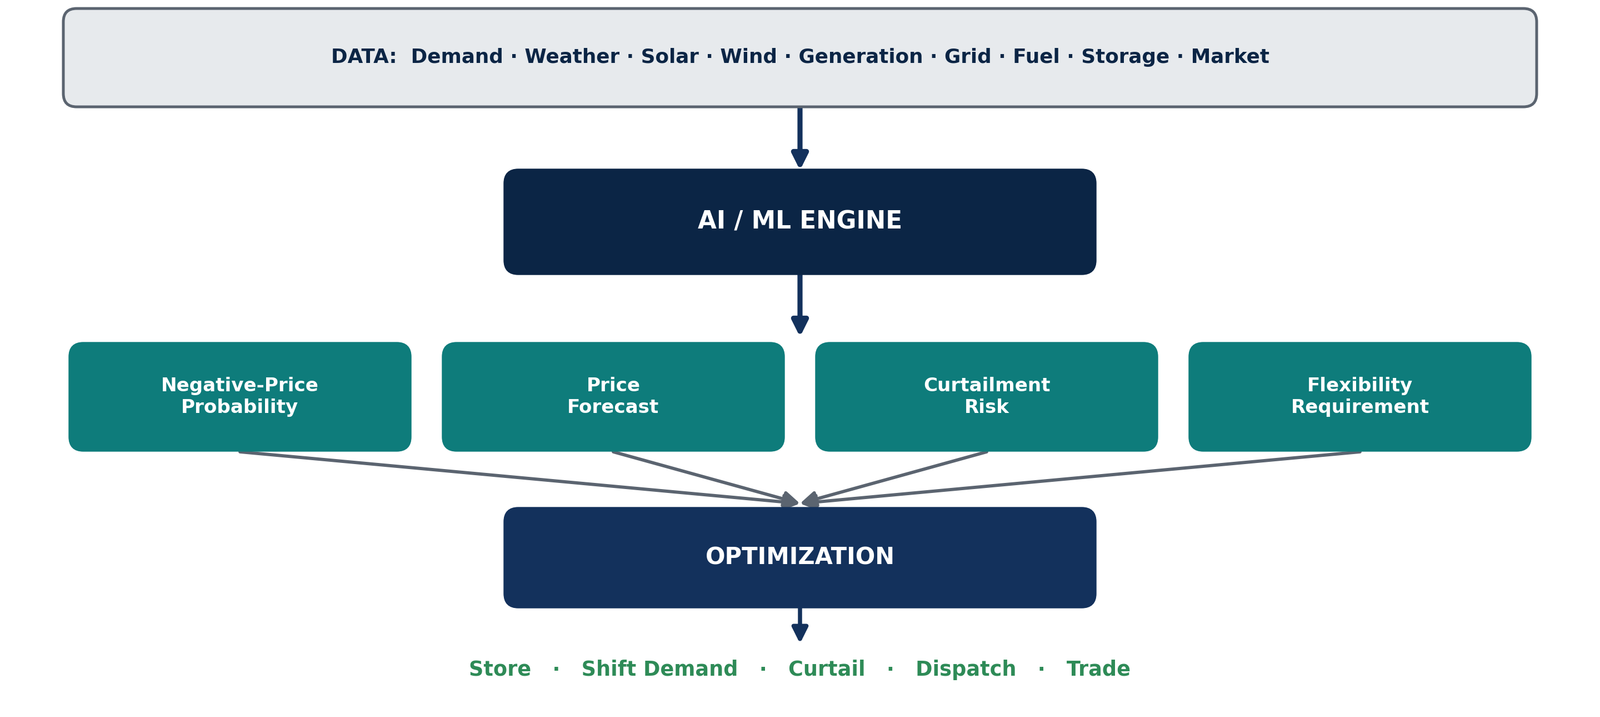
Figure 5. AI negative-price intelligence framework — from data to decision.
Five ways AI can respond
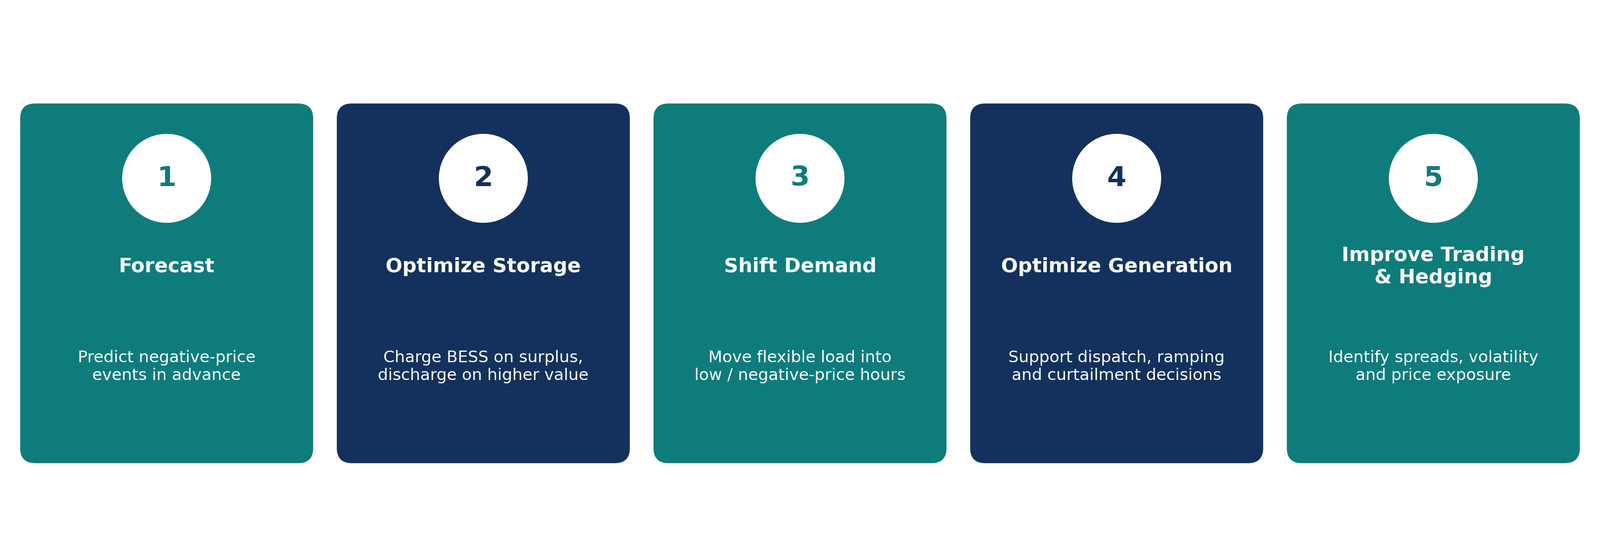
Figure 6. Five ways AI can respond to negative prices.
These five responses are complementary, not alternative. Forecasting establishes lead time; the other four convert it into action. Value depends on having a flexible resource to direct — analytics without flexibility produces insight but not outcome.
Flexible assets that benefit most
Negative prices can indicate excess renewable supply, insufficient flexibility or network congestion — genuine issues that warrant investment and market-design attention.
But the same hours also create value for battery storage, flexible demand, EV charging, hydrogen and electrolysis, energy traders and storage developers. A price signal below zero is, in effect, the system paying for flexibility it does not yet have.
“The objective is not necessarily to eliminate negative prices. It is to ensure that the power system has sufficient flexibility to respond efficiently when they occur.”
What AI cannot do
Credible analytics requires stating what these methods cannot do. AI does not eliminate negative prices, nor substitute for energy-market expertise.
Forecasts inherit their inputs’ errors: weather forecast error, incomplete outage disclosure and inconsistent metering propagate directly into price predictions.
Relationships learned on historical fleets decay as capacity mix, storage penetration and demand profiles change.
The deepest and most consequential price excursions are, by definition, the least represented in training data.
Price floors, bidding rules, support-scheme reform and settlement changes are breaks history cannot anticipate.
New interconnectors, large storage additions or retirements can invalidate learned relationships abruptly.
Probabilistic outputs must be communicated and used as distributions, not converted into false certainty.
Risk, trading and regulatory functions need models whose drivers can be interrogated and defended, not only scored.
“AI + high-quality data + energy-domain expertise is more valuable than AI alone.”
Flexibility becomes the scarce commodity
Several trends point the same way. Renewable penetration continues to rise across most major markets, extending the hours in which low-marginal-cost generation sets the price. Battery storage is deploying at pace and, as it scales, will arbitrage away part of the negative-price opportunity — the window is real but not permanent, and early, well-optimised entrants capture the most value.
Meanwhile demand is becoming more flexible and concentrated. EV charging, heat electrification and fast-growing data-centre load all represent at least partly schedulable consumption. Virtual power plants and dynamic retail pricing extend price signals to smaller participants, while digital grid infrastructure and flexibility markets create venues where responsiveness is monetised across several products at once.
The net effect: flexibility — not generation volume — becomes the scarce commodity, and multi-market optimization the discipline that determines returns.
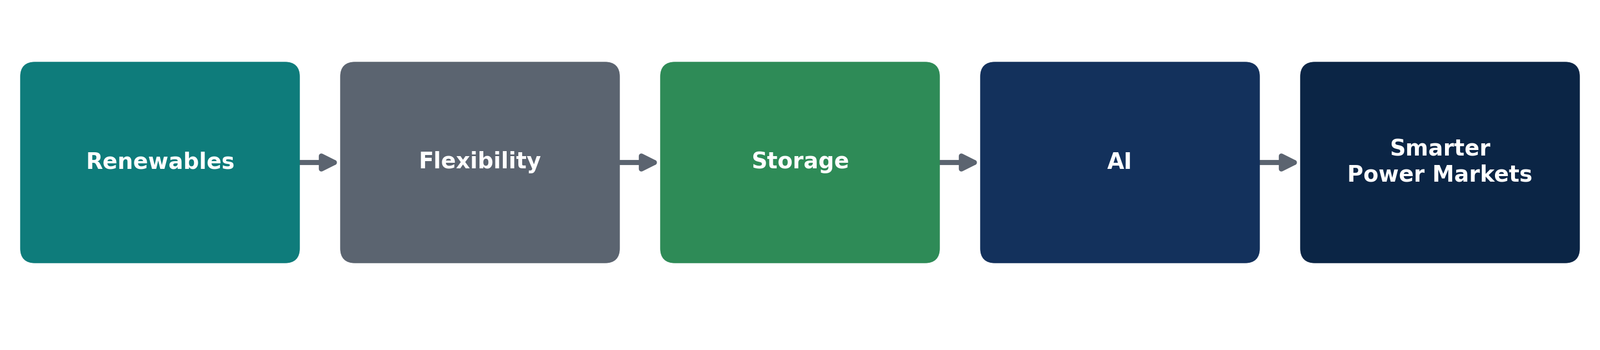
Figure 7. Renewables → Flexibility → Storage → AI → Smarter power markets.
“As power systems become more renewable and decentralized, the ability to forecast and manage periods of oversupply will become increasingly important. AI can help transform negative-price events from a reactive problem into an anticipatory flexibility opportunity.”
National system operators and market operators. Published wholesale market price, curtailment and constraint data. Publicly available reporting.
Energy regulators and government statistical agencies. Market monitoring and electricity statistics publications.
Published academic literature on short-term electricity price forecasting in high-renewable markets, including ensemble, gradient-boosted tree, neural sequence and quantile regression methods.
ESIQ. (2026). Negative-price intelligence: analytical framework. ESIQ Research.
Methodology note: sources comprise publicly available data and reporting from national system operators, market operators, energy regulators and government statistical agencies. The mechanisms described are not identical across markets and should not be generalised. Illustrative figures are clearly labelled and do not represent actual market observations. This article is provided for informational and educational purposes and does not constitute trading, investment or regulatory advice.
Research built for oversupply decisions
ESIQ works at the intersection of energy markets, sustainability and applied analytics. ESIQ’s analytics capabilities can be applied across the negative-price problem: power-market intelligence and commodity analytics to establish context; AI-enabled forecasting of prices, demand and renewable output; weather and renewable-generation analytics; scenario modelling of penetration, storage and curtailment pathways; BESS and flexibility analytics; price and volatility analysis; and strategic decision support. Potential ESIQ applications span the capability chain below, scoped to each client’s market, data availability and asset position.
Power-Market Intelligence
Commodity analytics and market-design context to establish how negative pricing manifests in a specific jurisdiction.
AI-Enabled Forecasting
Probability, duration and depth of negative-price blocks alongside price, demand and renewable-output forecasts.
Weather & Renewable Analytics
Irradiation, wind, hydrology and temperature analysis, including correlated cross-border risk.
Scenario & Curtailment Modelling
Penetration, storage and curtailment pathways, plus extreme-event stress testing.
BESS & Flexibility Analytics
Charge/discharge optimization against forecast spreads, revenue stacking and capture-rate modelling.
Strategic Decision Support
Price and volatility analysis translated into procurement, hedging, dispatch and investment decisions.
Navigating grid oversupply and price volatility?
ESIQ partners with generators, grid operators, investors and technology providers to turn power-market signals into decision-ready intelligence.
Continue the research
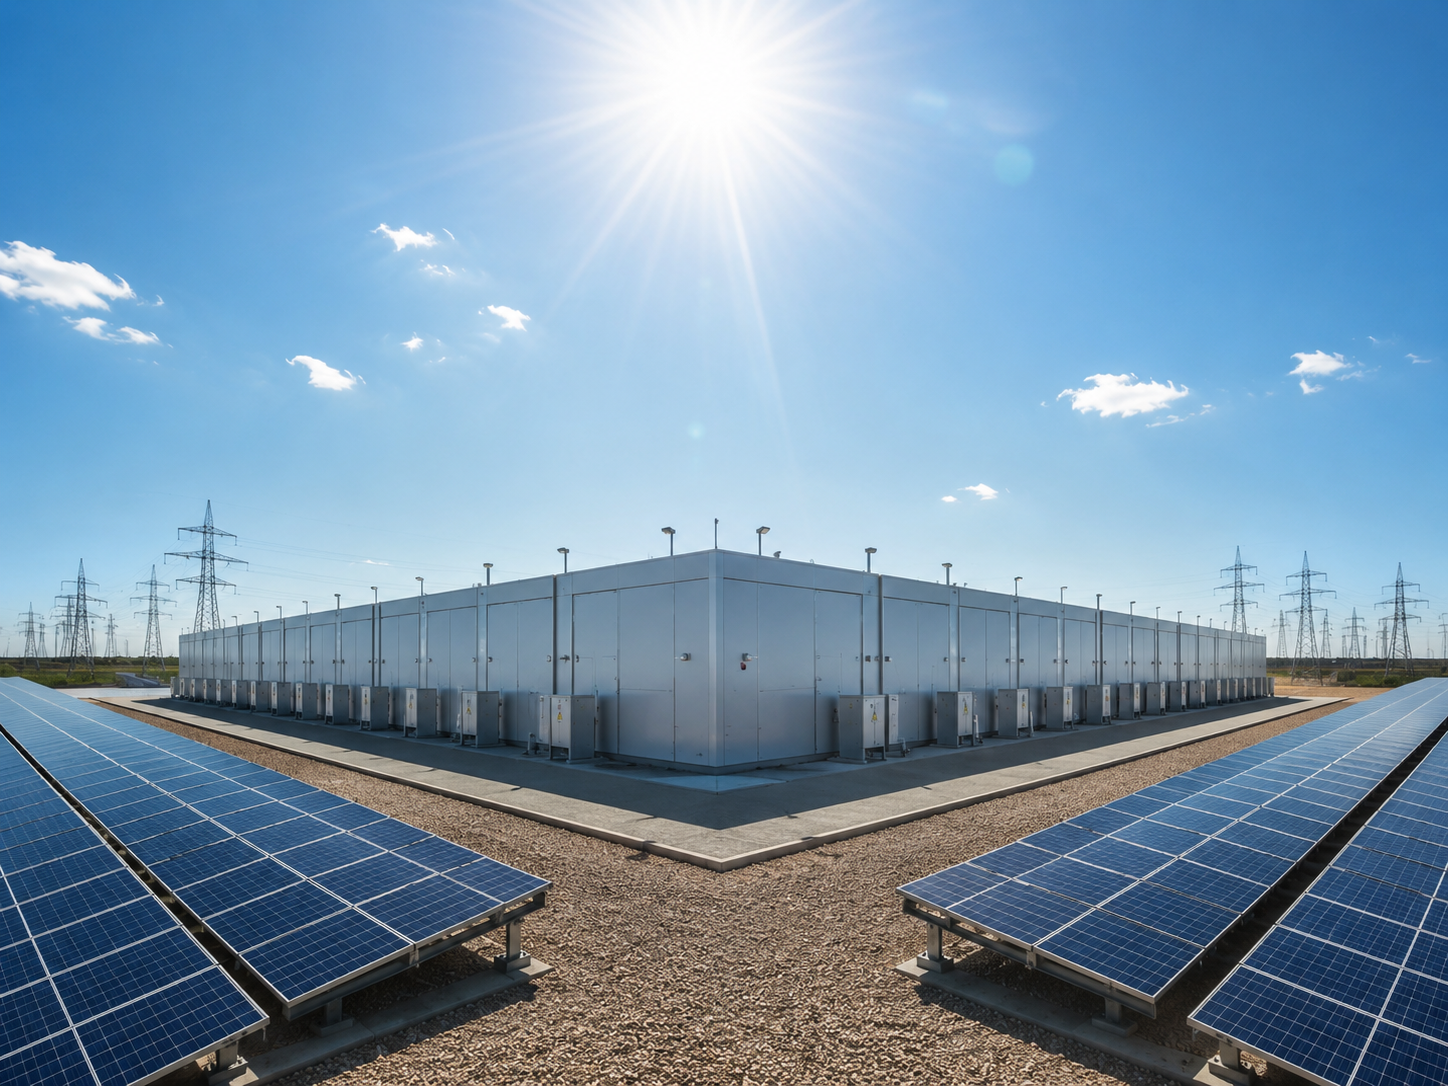
The Battery Fix
How battery storage is solving the energy transition's real bottleneck by moving from passive storage to grid support, stability and renewable-heavy power systems.
Read More →
From Ambition to Market Reality: Where Could India's Green Hydrogen Opportunity Emerge?
A scenario-based view of India's green hydrogen opportunity across demand, supply, sector adoption and the emerging market gap.
Read More →
Marine Shipping Decarbonisation
Navigating the transition to low-carbon shipping — the regulations, fuels, infrastructure and freight economics reshaping global trade.
Read More →